I got less regular about writing here semi-regularly. 😑
A bunch of work on climate change – 82 paper letters, 12 emails, 2
protests, phone calls, in-person meetings with local politicians,
and submissions against LNG expansion in BC. I didn’t meet my
target of 110 letters; however, I’m starting to have second thoughts
about those kinds of targets for personal goals.
Two new hardware hacking projects: tree tomography and the
one-pixel camera. Finished up the weather vane; no nesting from the
chickadees this year. Seismometer set up. Lots of small random things.
A year of working at Wyvern! I think the infrastructure codebase is
in good shape.
Health was a mix: nothing terribly serious, but COVID plus two sinus
infections. Bleah.
Walking: 6.8 km/day average for the year. Down from 7.0 last year.
Obviously this is the end times.
Gave up on hosting my own email and delegated it to EasyDNS.ca.
Recommended.
Started learning Italian. È molto divertentimento!
Nature: 475 checklists for eBird (vs target of 450); 1671
observations for iNaturalist (vs target of 1300) and 3730
identifications (vs target of 900).
I read 53 books. Of these, “The Good War” by Studs Terkel was
the most mind-blowing; it’s an utterly compelling oral history,
mainly from the American point of view, of people’s involvement in
World War II. I had never thought that moral ambiguity about a war,
or deep suspicion about the US government’s action in a war, was
anything but a recent development. Highly recommended.
A quick summary before I work on the year-end post.
Hardware hacking
More work on the tree tomography project, including much writeup on
Hackaday.io:
Hammer of Science: a da Vinci hammer first done in cardboard and
then wood.
Code for microsecond-level time-of-flight measurements.
Initial analysis & graphing.
A prototype board for the Pi Pico, with connections for the piezo
sensors, that doesn’t suck.
Side note: I wanted to see what it was like to document things on
Hackaday.io, so I added the project & was curious to see how I’d
like it. While the site has a few little hiccups, it’s pretty good.
What stood out to me, though, was how much I wrote there as opposed
to here. I think there are a few reasons for that: the different
audience (and, honestly, the chance for a nice dopamine attention
hit); the novelty of writing on a different website; and the ease of
adding images.
That last point is pretty big: I’d never thought before about what a
difference that makes. I work with Emacs, and as a text editor I
love it – but the process I have for adding pictures is clumsy.
This needs some thought; I know there are graphical markdown
editors, but I’d hate the idea of giving up the sheer flexibility I
have with Emacs.
Not exactly hardware hacking, but: I got a Keychron Q8 programmable
mechanical keyboard, and OMFG I love it. The switches are
Gateron G Pro Reds, so it’s fairly quiet. I’d never understood the
appeal of mechanical keyboards before, but I get it now. But the
programmable part is even bigger; I’m able to set this up with the
keyboard shortcuts I’d always wanted.
Began working on replicating a project written up on Hackaday.com
in 2016: a one-pixel camera. There was an episode of the
Hackaday podcast where one of the hosts called for people to
trawl through that site’s vast archive and look for fun projects;
that seemed like a great idea, and in short order I tripped over the
one-pixel camera. This was a great excuse to order a bunch of
servos, so I did. Current status:
I was able to get an X-Y setup with two servos and an Arduino
controlling them directly, and have it scan a field of view
successfully.
I’m now working on duplicating that by controlling (and
powering) them through a PCA9685 module.
I was able to set up a single photoresistor & get measurements
from it.
I’ve got Python code to graph those measurements.
So far, the results aren’t great, but I’m plugging away on it.
Nature
More observations for iNaturalist, of course.
I’ve taken a couple of freshwater samples from local streams to keep
at home, so that I can examine the organisms in there a bit closer.
I’ve found Eucyclops, copepods, pocopods, and
pea clams. Terribly fun!
Climate emergency
Still trying to book a meeting with my MLA; this has taken longer
than expected. But I was able to meet her, along with my federal
MP, briefly at a Christmas community event & talk about climate
action, so there’s that.
Emailed New Westminster City Council about following Nanaimo’s
example and banning new natural gas hookups; got reply from 2
councillors (both in favour) and the mayor (in favour, though wants
to see how this can be worked into current city policy). In
general, I’m very happy with how our current mayor & council are
handling this…though I’d like to see more serious engagement from
the New West Progressives, who seem more focused on scoring points
than actually getting anything done (whether about climate or
anything else).
Submissions to the BC government against the Ksi Lisims LNG project.
I’m continuing to learn Italian through beginner courses at the
Italian Cultural Centre. This is really fun; it’s such a
stretch for my brain. My reading comprehension is coming along; my
spoken comprehension is, uh, ripe for improvement; and I’m still
slogging through the grammar and tenses. The “Italiano Bello”
and “Simple Italian” podcasts help a lot.
Start graphing data for air quality in Sault Ste Marie, where my
parents live. It’s not great. ☹️
Climate emergency
Continuing to send letters to provincial and federal government
asking for faster action.
Continuing to pester my MLA for meetings.
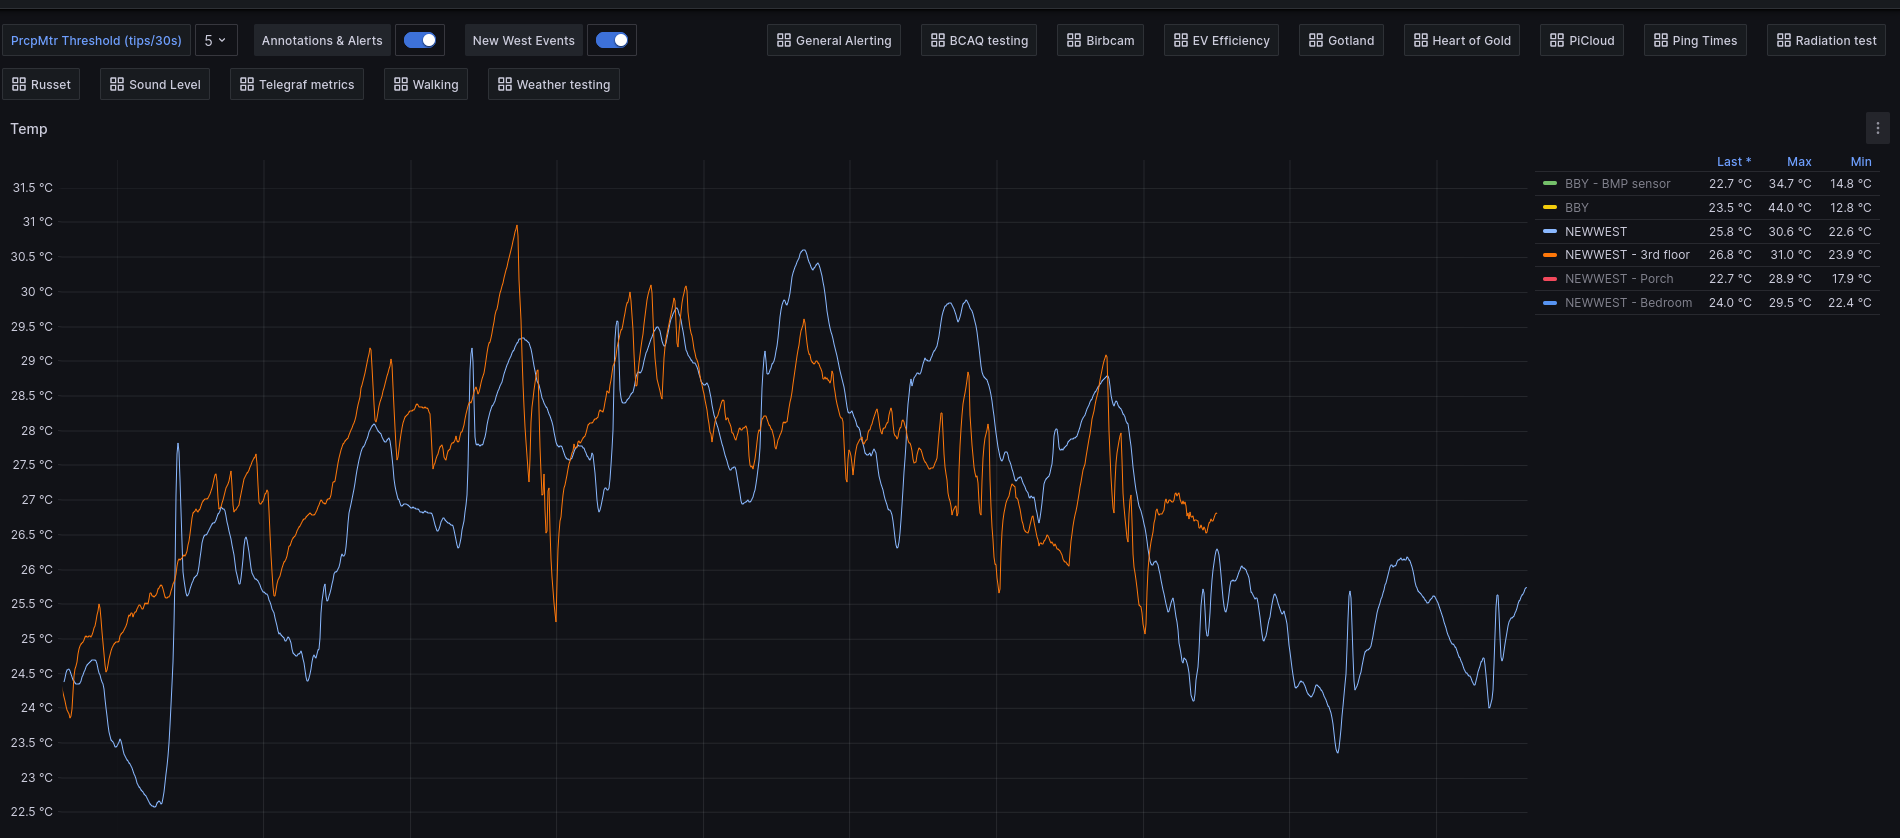
Got a portable AC just in time for the heat wave this summer.
Internal temps in our home office went over 30.5 C, but our 3rd
floor (where the kids sleep) stayed reasonably comfortable:
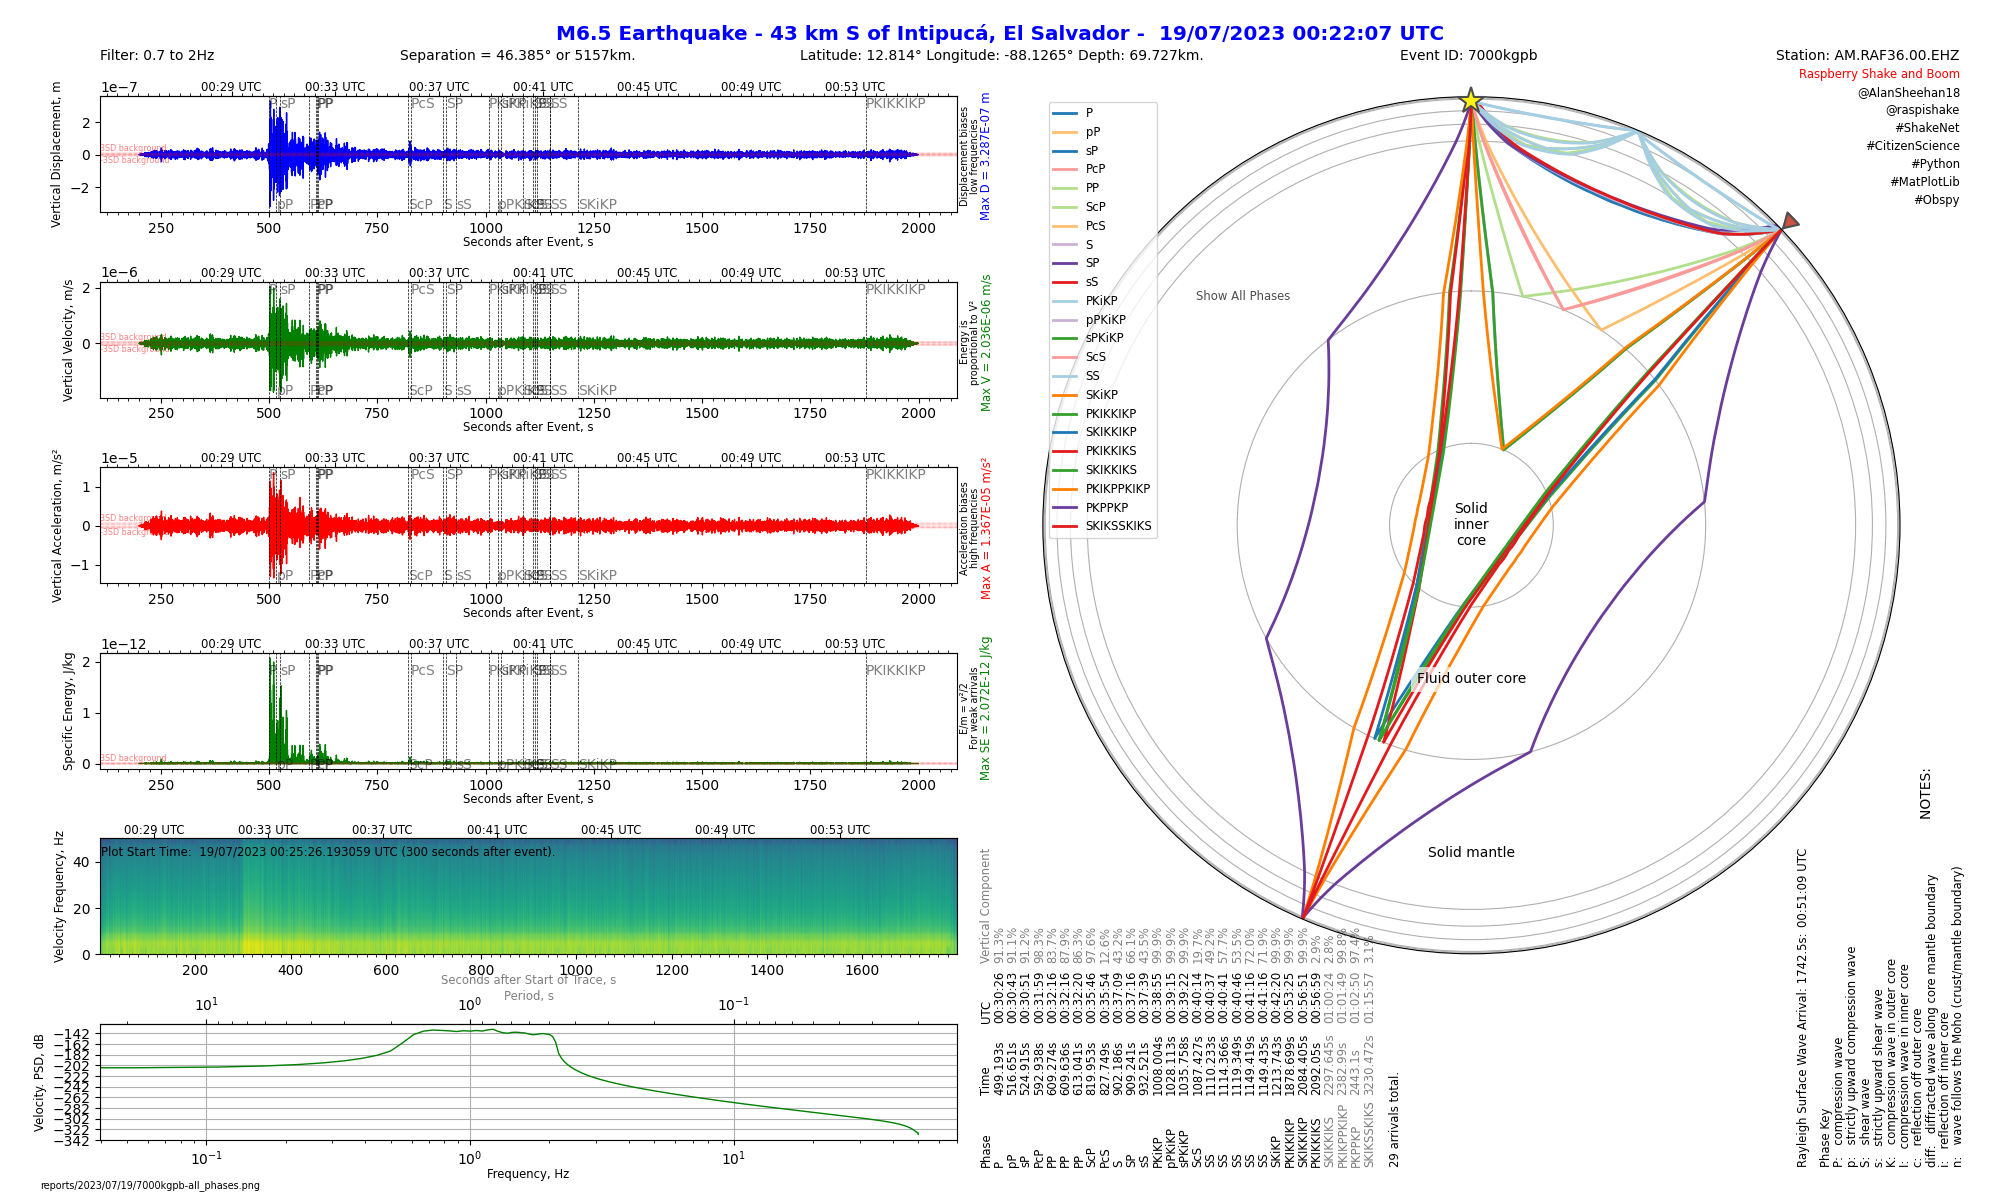
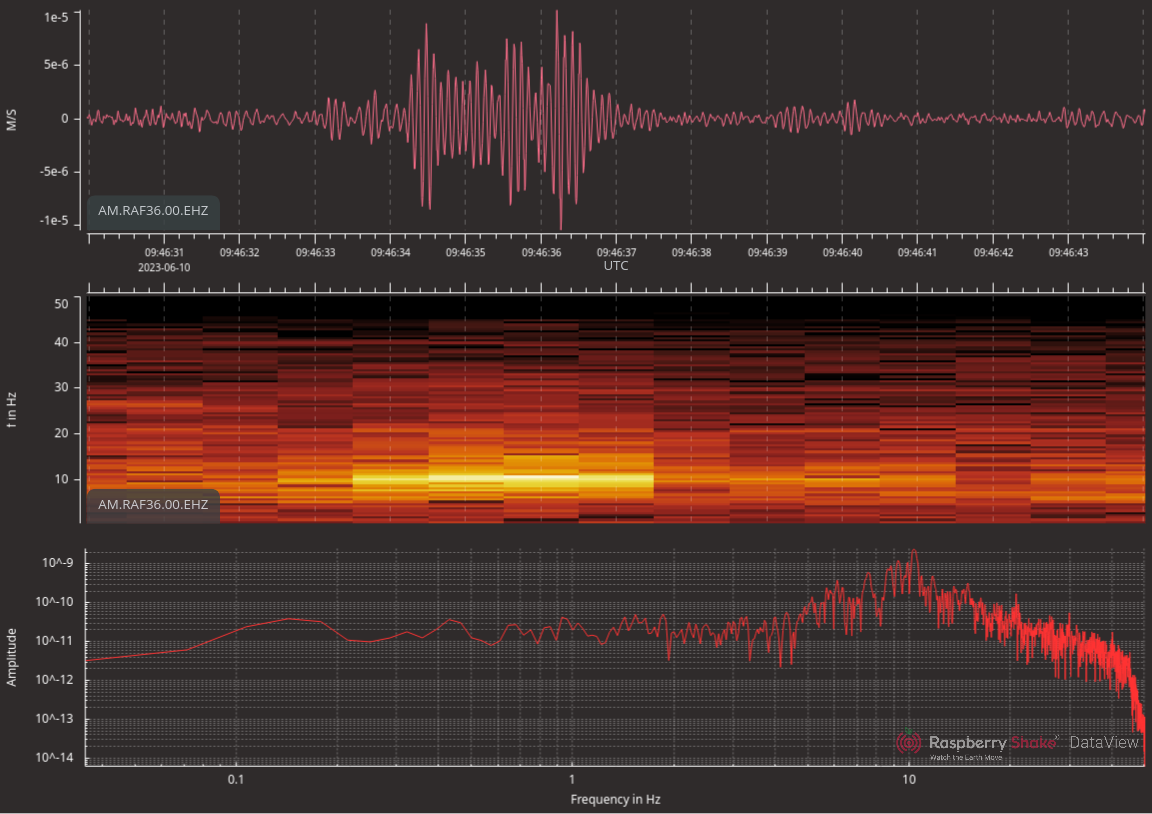
I’ve found much better ways of examining earthquake data
received by my station. Thanks to Alan Sheehan, who was kind enough
to post his excellent report generation tool, I’ve now got some
actual data we can use. I’ve updated his code a bit and changed it to
better match my workflow; my repo is here. Like Alan’s, my code
is under the MIT License. Share and enjoy!
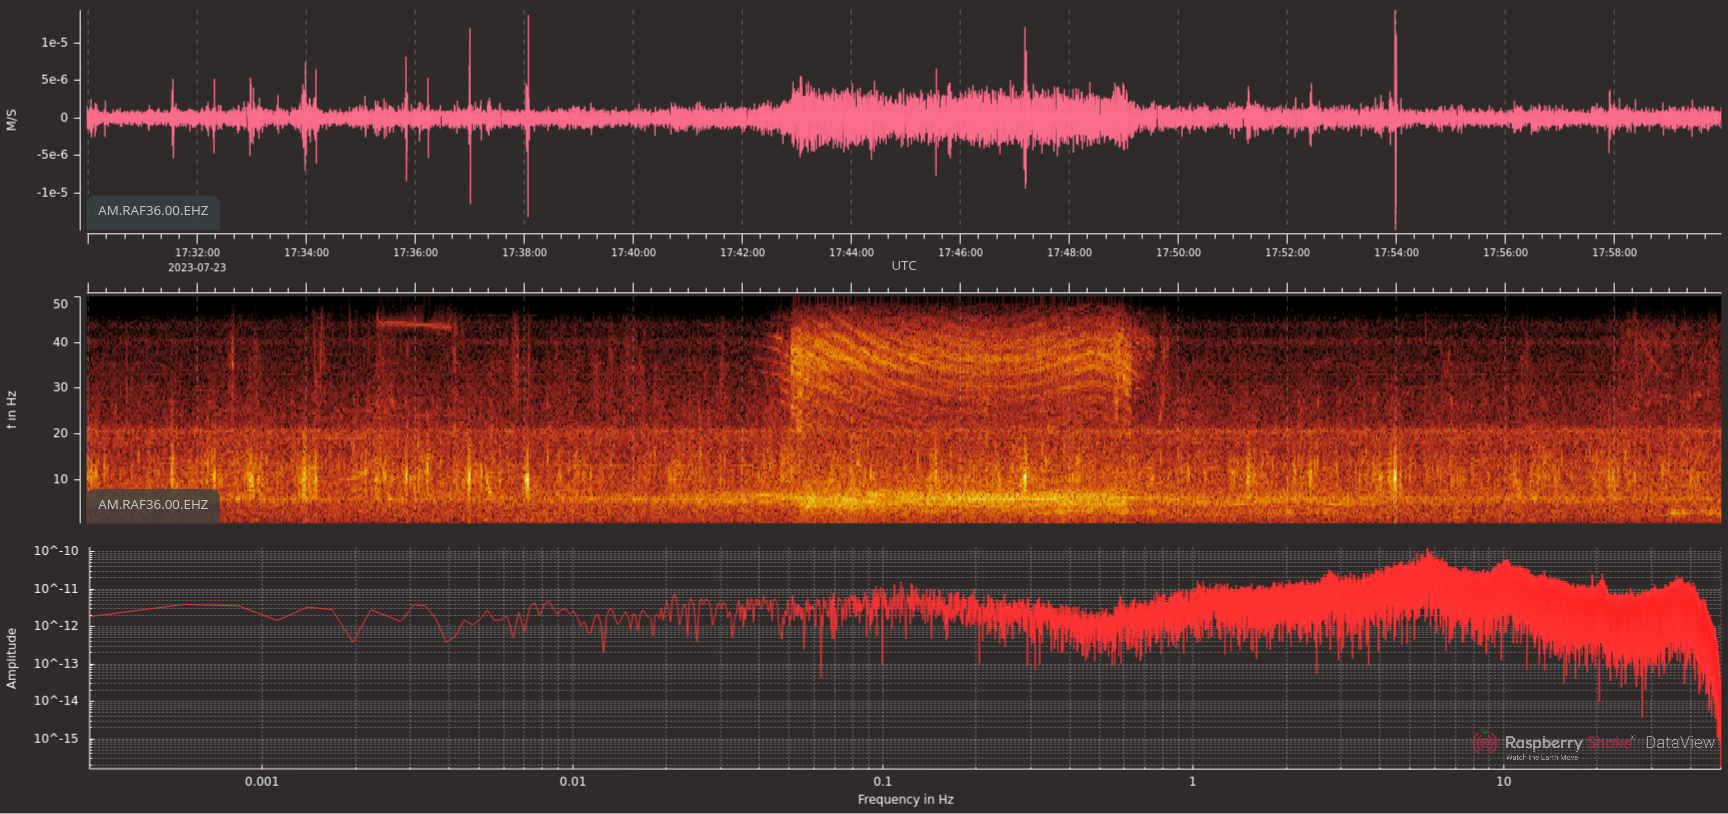
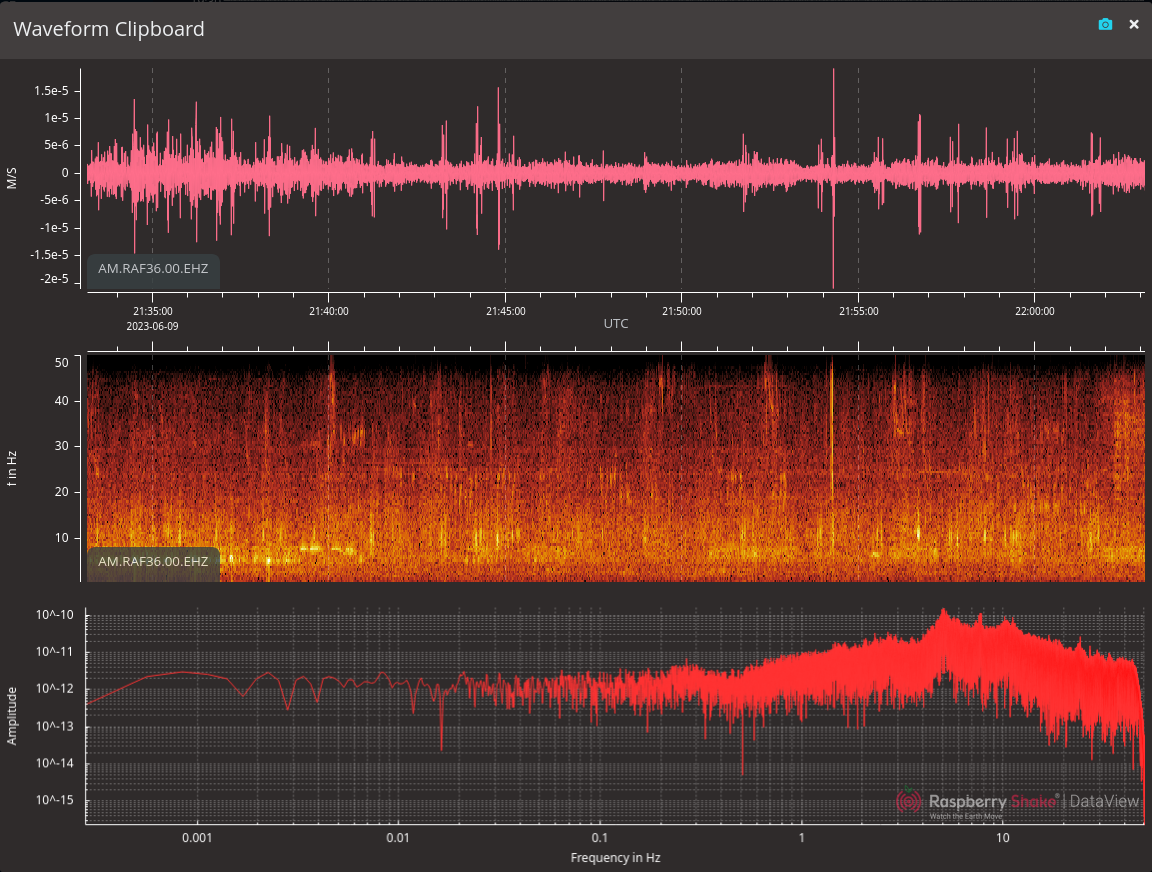
Here’s a sample of what I’m pretty sure is a freight train going by:
This happened about 15 minutes after I saw the train go by another
crossing about 10km west of where the seismometer lives. The
equidistant lines in the spectrum sure seem like the ones reported in
this study, “Equidistant Spectral Lines in Train Vibrations” by
Florian Fuchs, Götz Bokelmann, and the AlpArray Working Group
(https://doi.org/10.1785/0220170092 …but see the previous link for
the actual paper).
Weathervane: FINALLY IN PLACE. It only took a year.
Incidentally, the last bit of this was trying to get a [Coral dev
board0 to work with a USB serial device. Turns out the kernel
doesn’t include the driver, which (╯°□°)╯︵ ┻━┻. And after
two weekends of trying, I gave up trying to rebuild the image;
all of the instructions I found were out-of-date, including
the ones from Google. What a crock.
Tried building a local web app to play random everynoise.com
playlists, inspired by this article. It turned out to be
reasonably straightforward in the end, though my Flask code is going
to make baby Jesus cry.
Started scraping pollen forecasts (late-onset allergies are fun).
Discovered that the requests module has a super-helpful sessions
object, which lets you (say) persist cookies across requests.
Recommended if you’re, uh, doing research on how to scrape APIs for
fun.
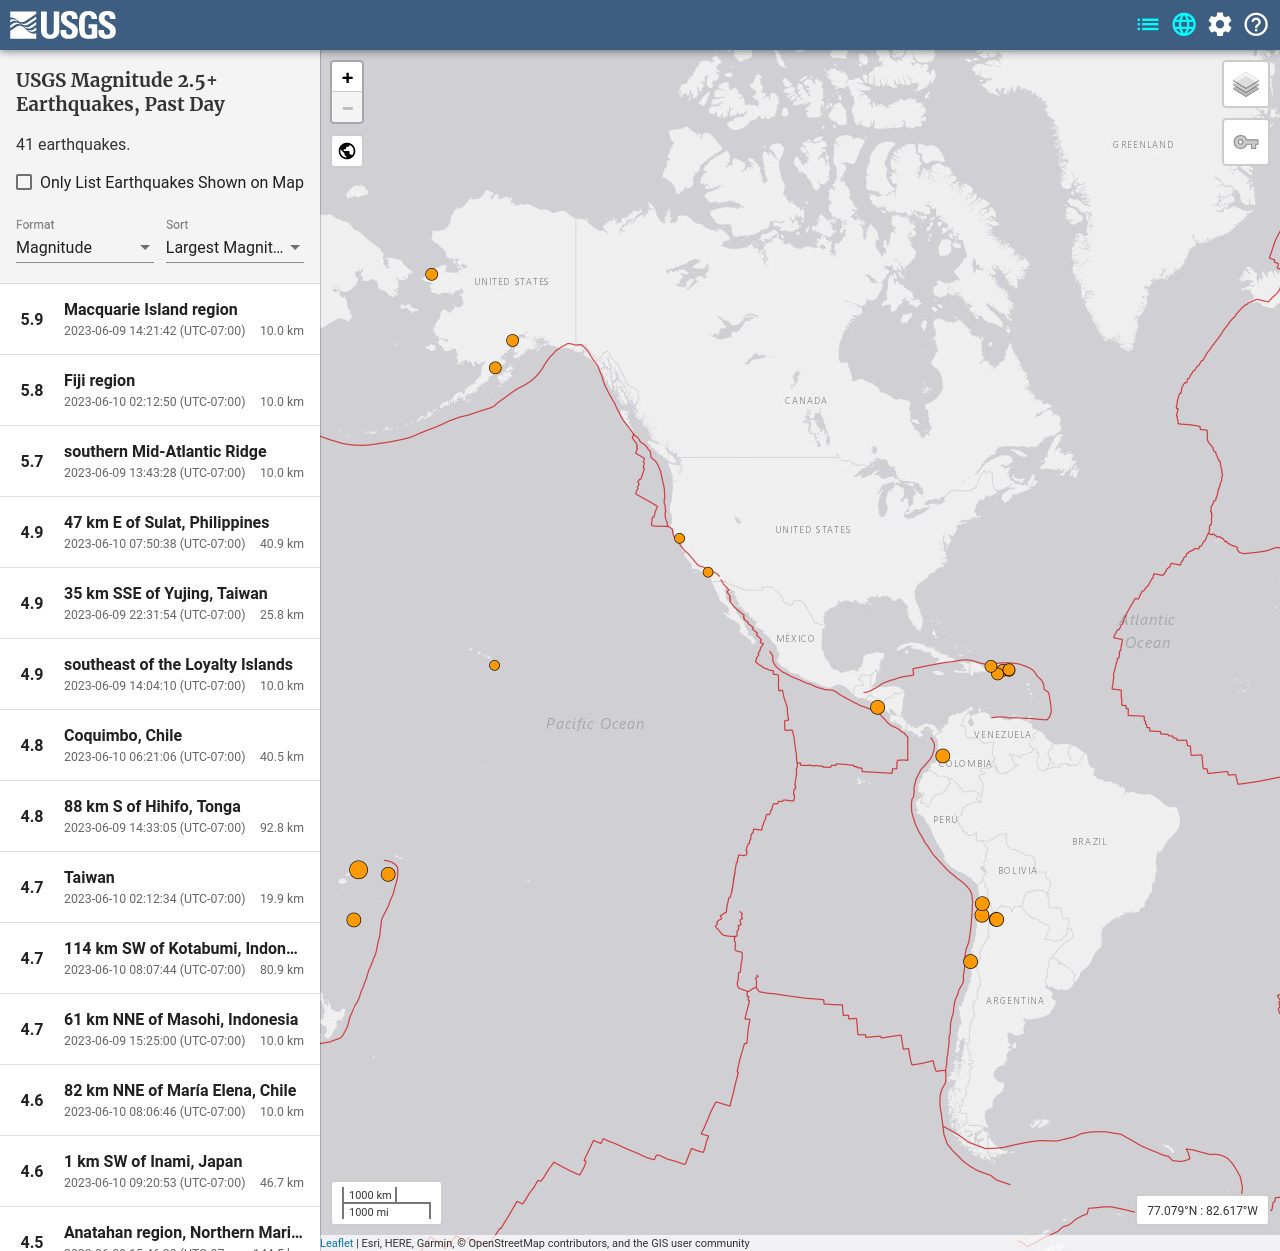
Hello, world! A couple weeks ago, I took delivery of a Raspberry
Shake 1D. It’s pretty sweet. Right now it’s set up at my inlaws'
house, and I wanted to see how it’s doing by looking at whether it can
detect recent larger earthquakes.
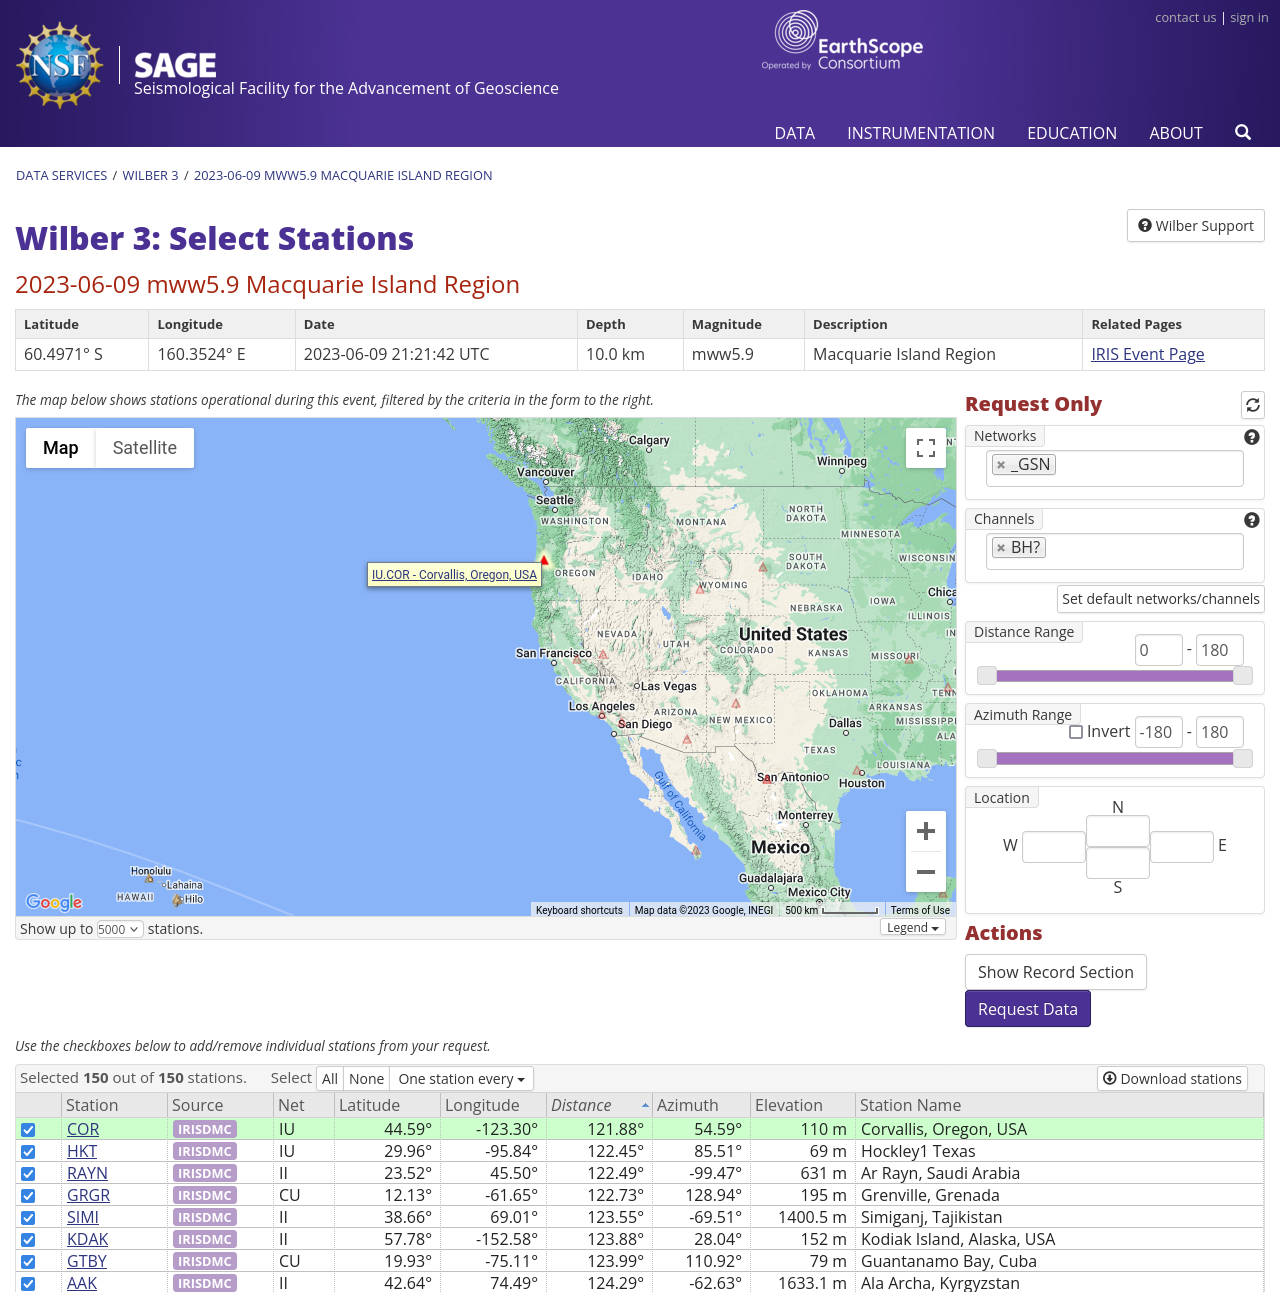
Macquarie Island Region: Mag 5.9, June 9 2023, 21:21:42 UTC
From there I can drill down to individual earthquakes – such as that
first one, 5.9 in the Macquarie Islands. Going to Waveforms
takes me to this page, which lets me find stations that recorded
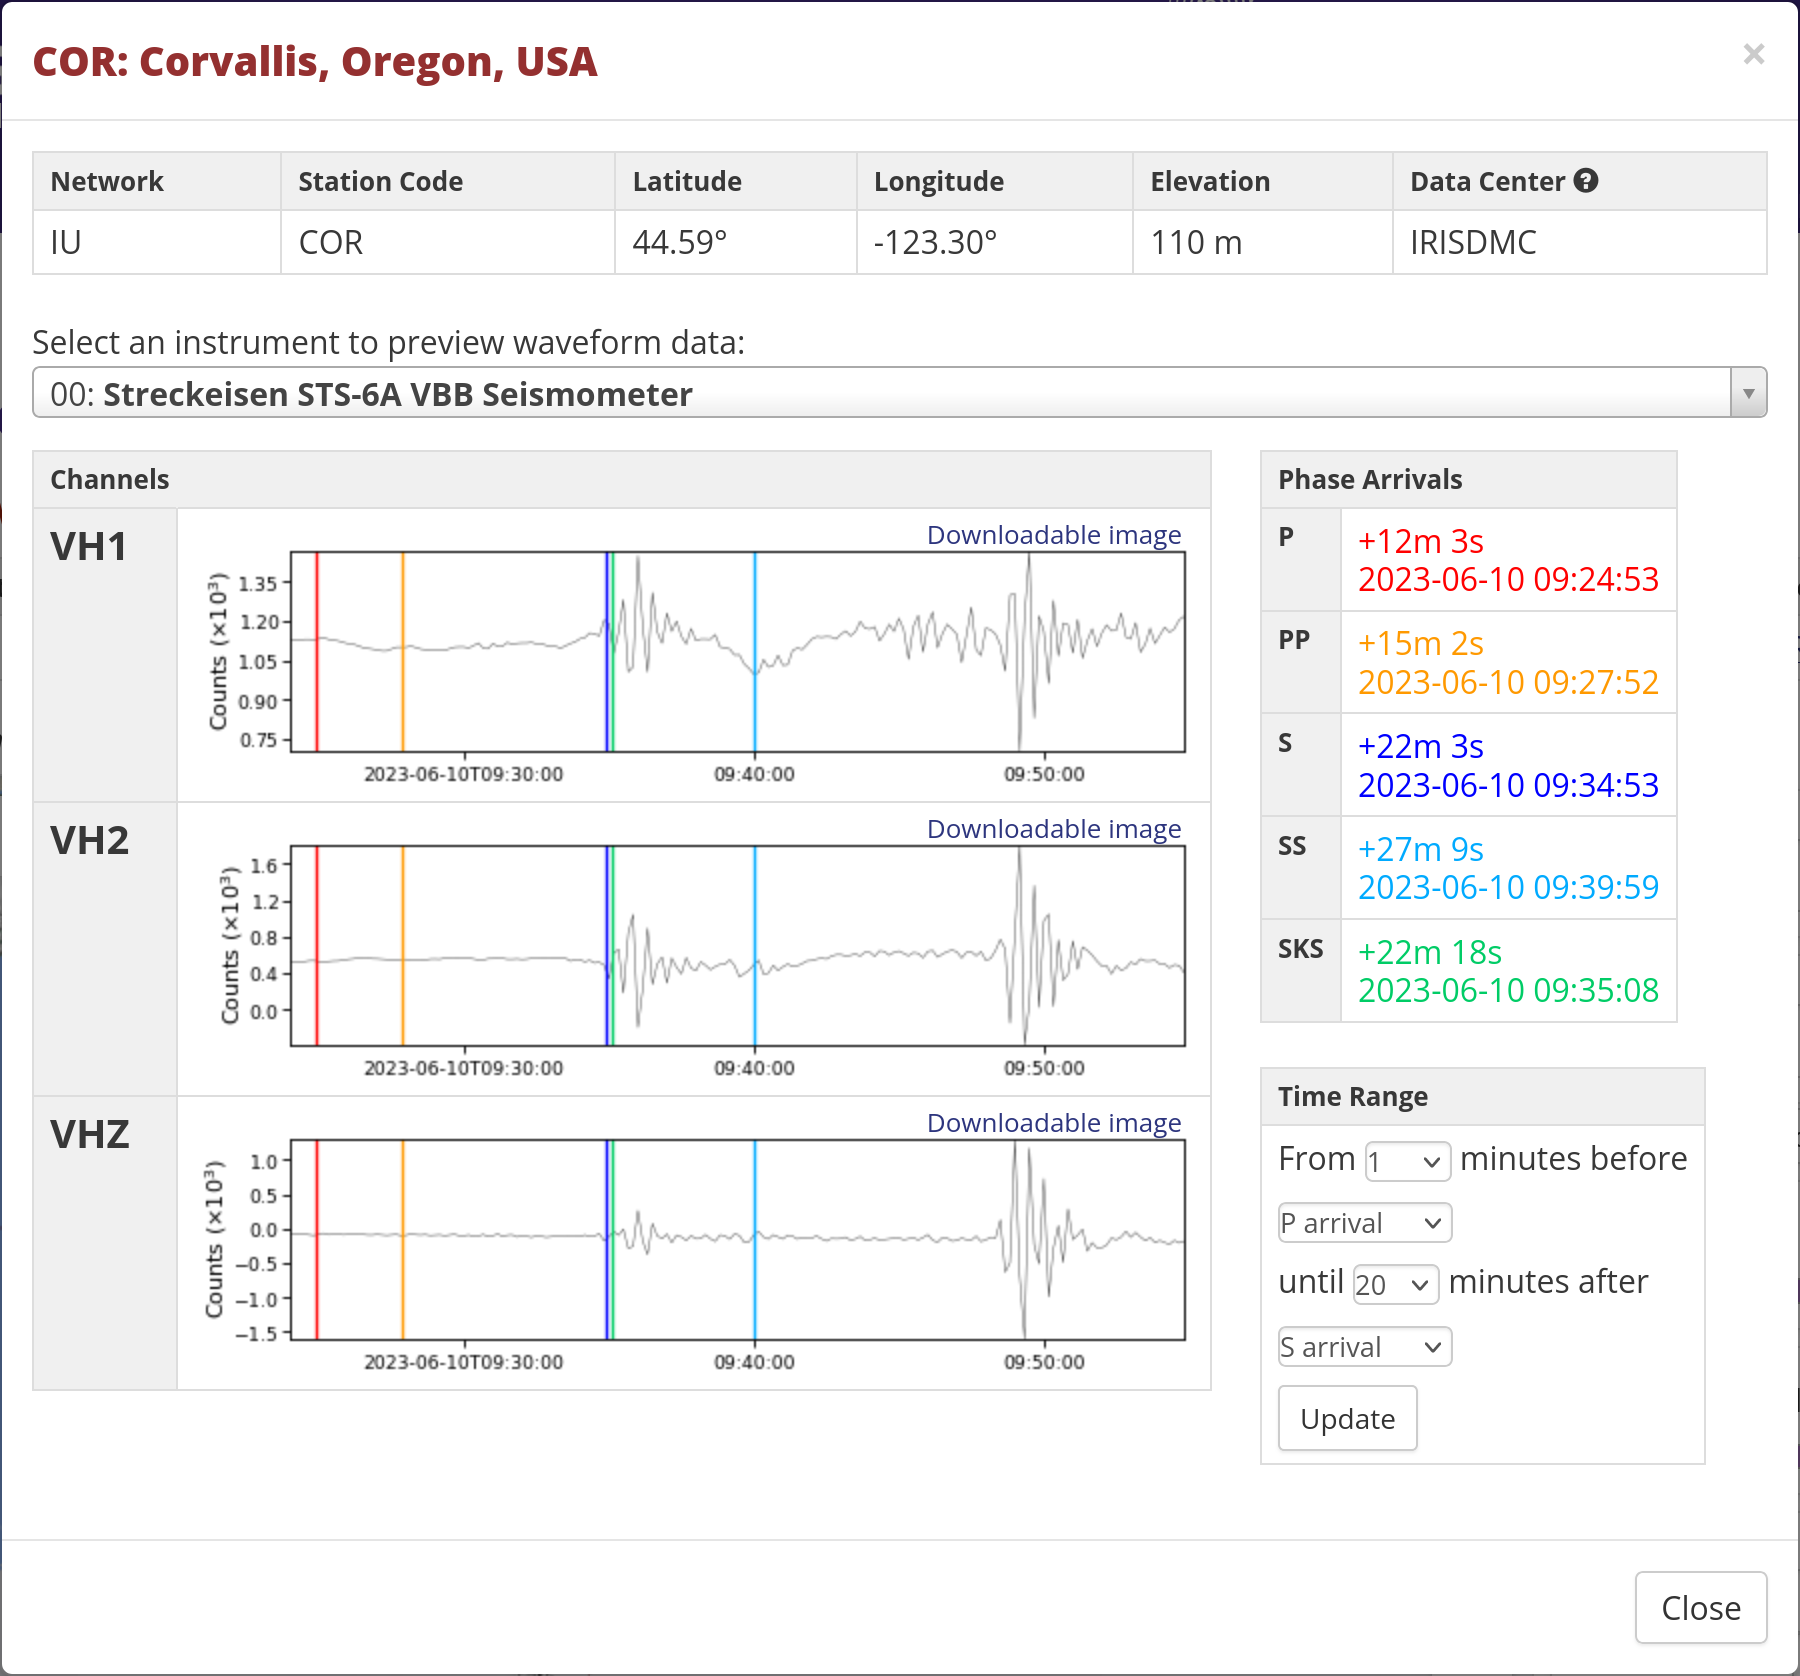
data from it. Looks like there’s one in Corvallis, Oregon:
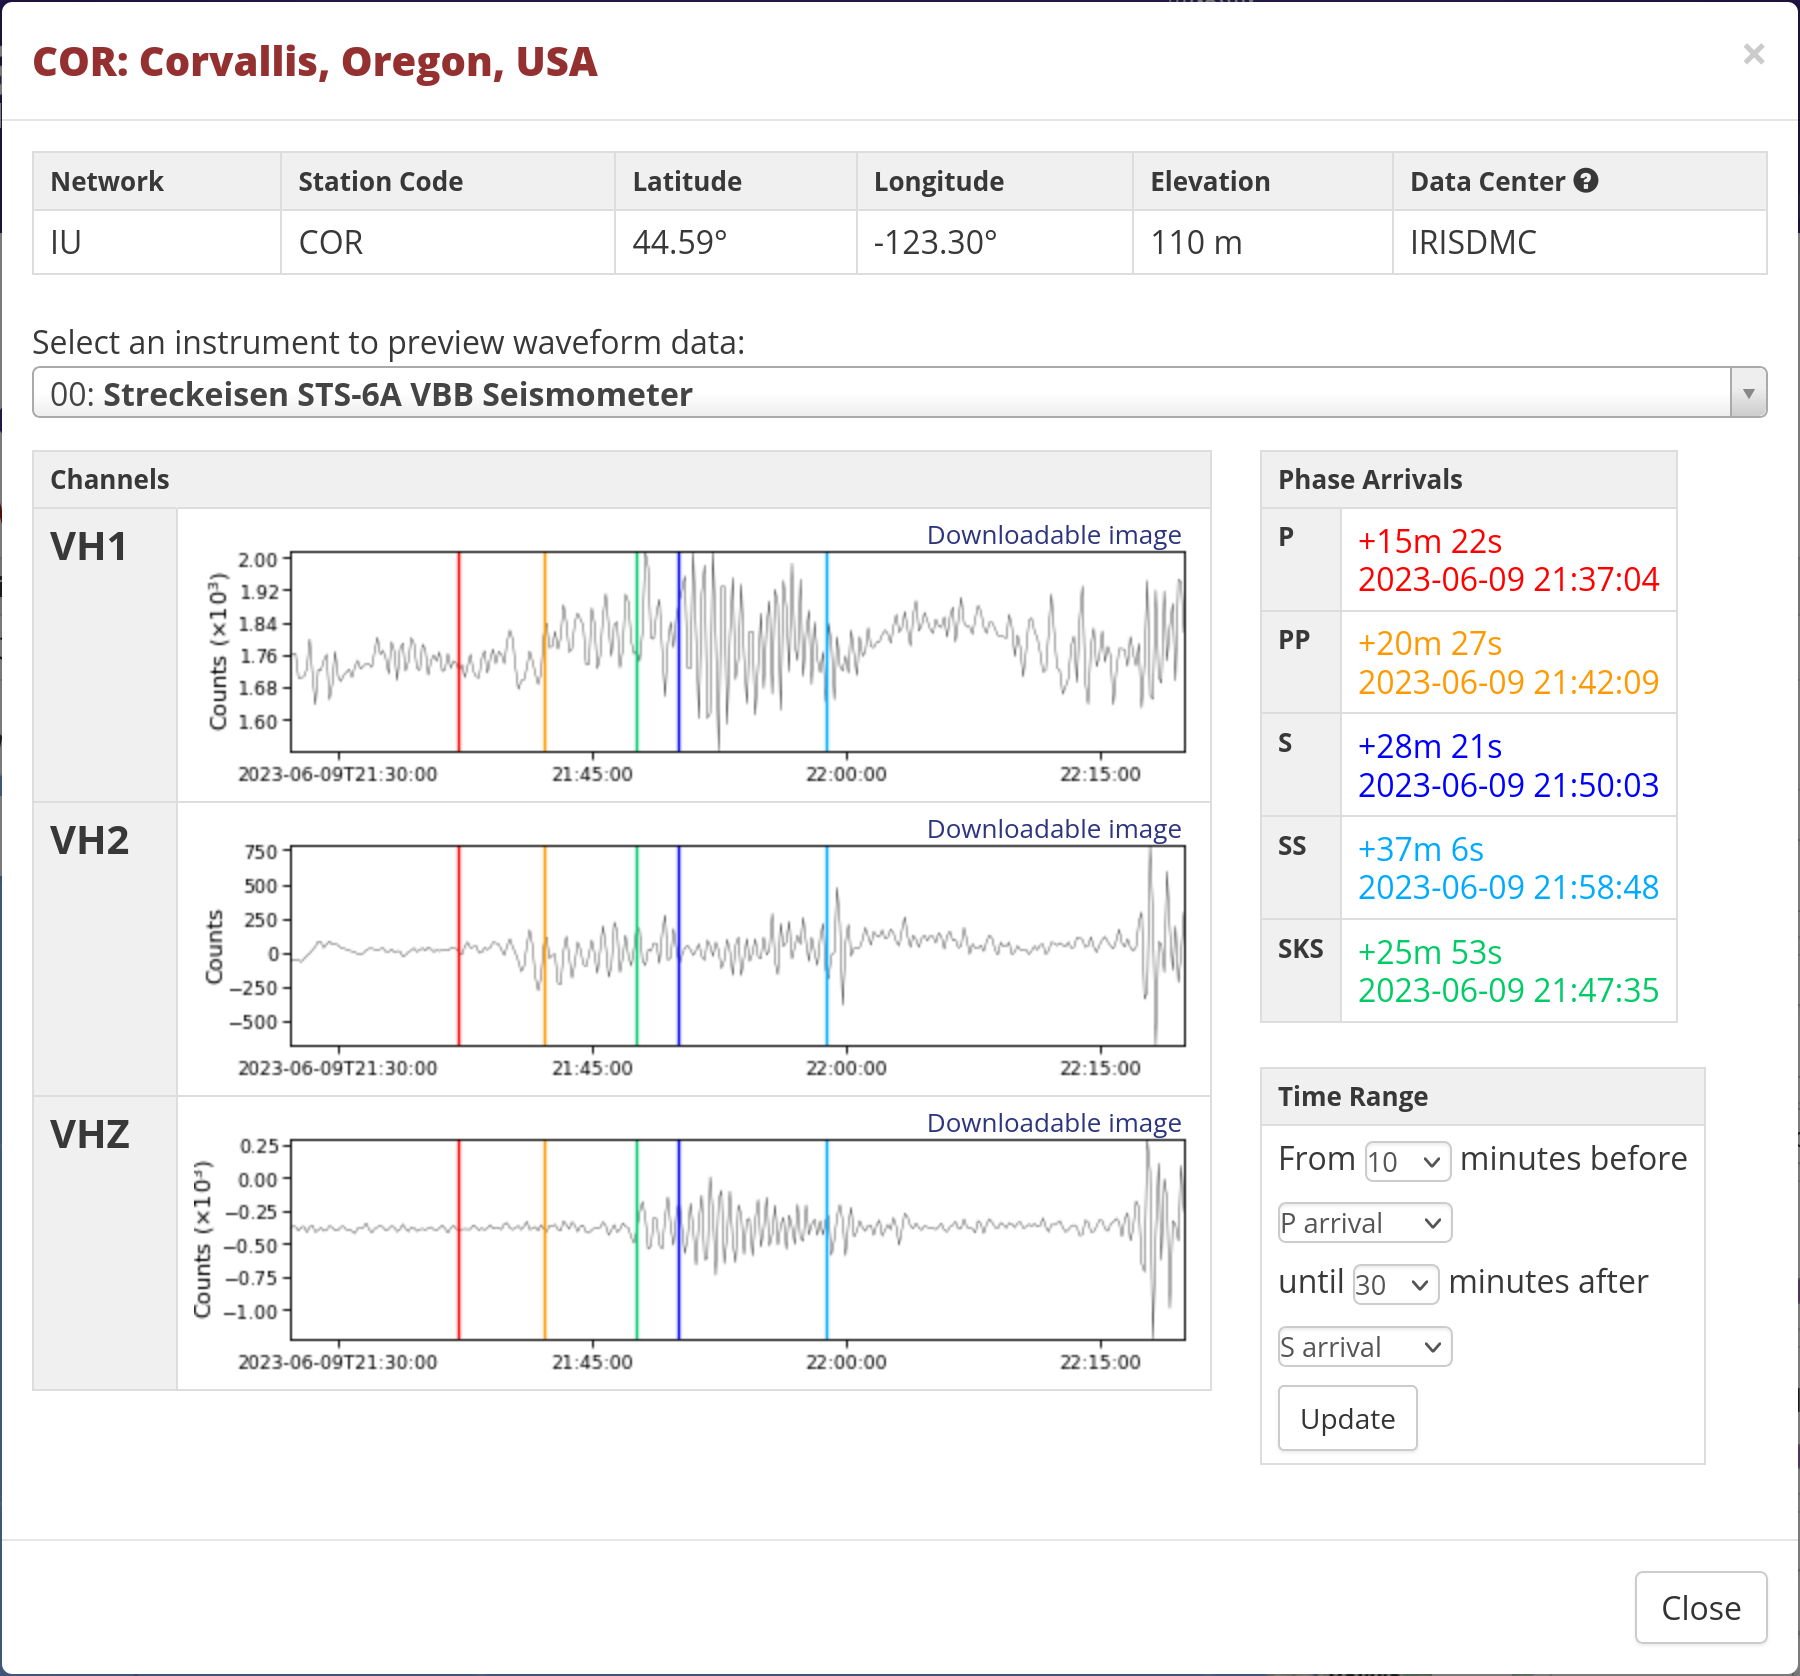
Clicking on that gets me the data:
Side note: this is narrowed down to VH channels. V means a sample
rate of ~ 0.1 HZ; H is a High Gain seismometer; and Z means vertical
orientation. From there I can see when the phases arrived. The original
earthquake, according to the USGS, happened at 2023-06-09 21:21:42
(UTC); the P phase arrived 15 & a half minutes after that, and
other phases past that. The P is barely noticeable, but the PP and S
waves definitely show up.
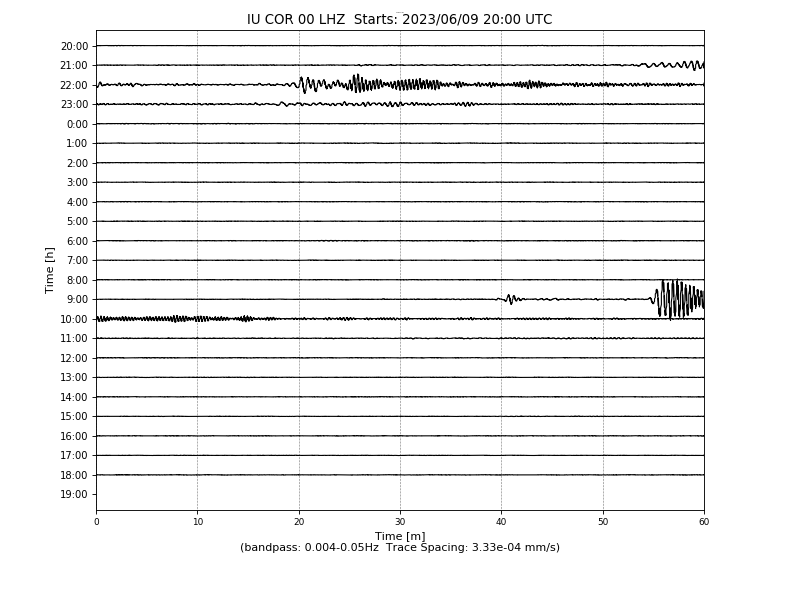
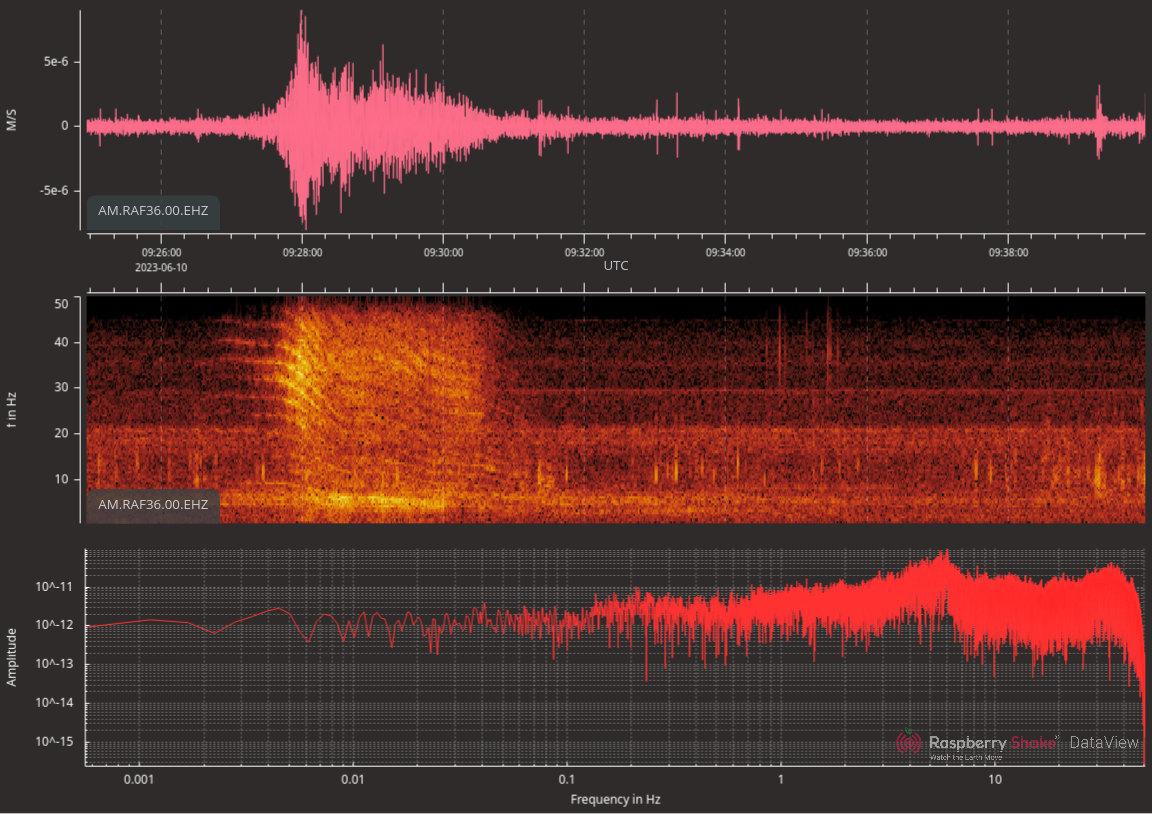
It’s interesting to compare this with the heliplot:
So – how does this compare to my seismometer? The Corvallis
station is 13,550 km away; mine is 13,990 km. The arrival
time should be a little later – by simple/stupid math, about 30
seconds later.
I’ll be honest: for this one, I’m not sure I see anything. The spike
around 21:52 seems like a candidate for the S wave.
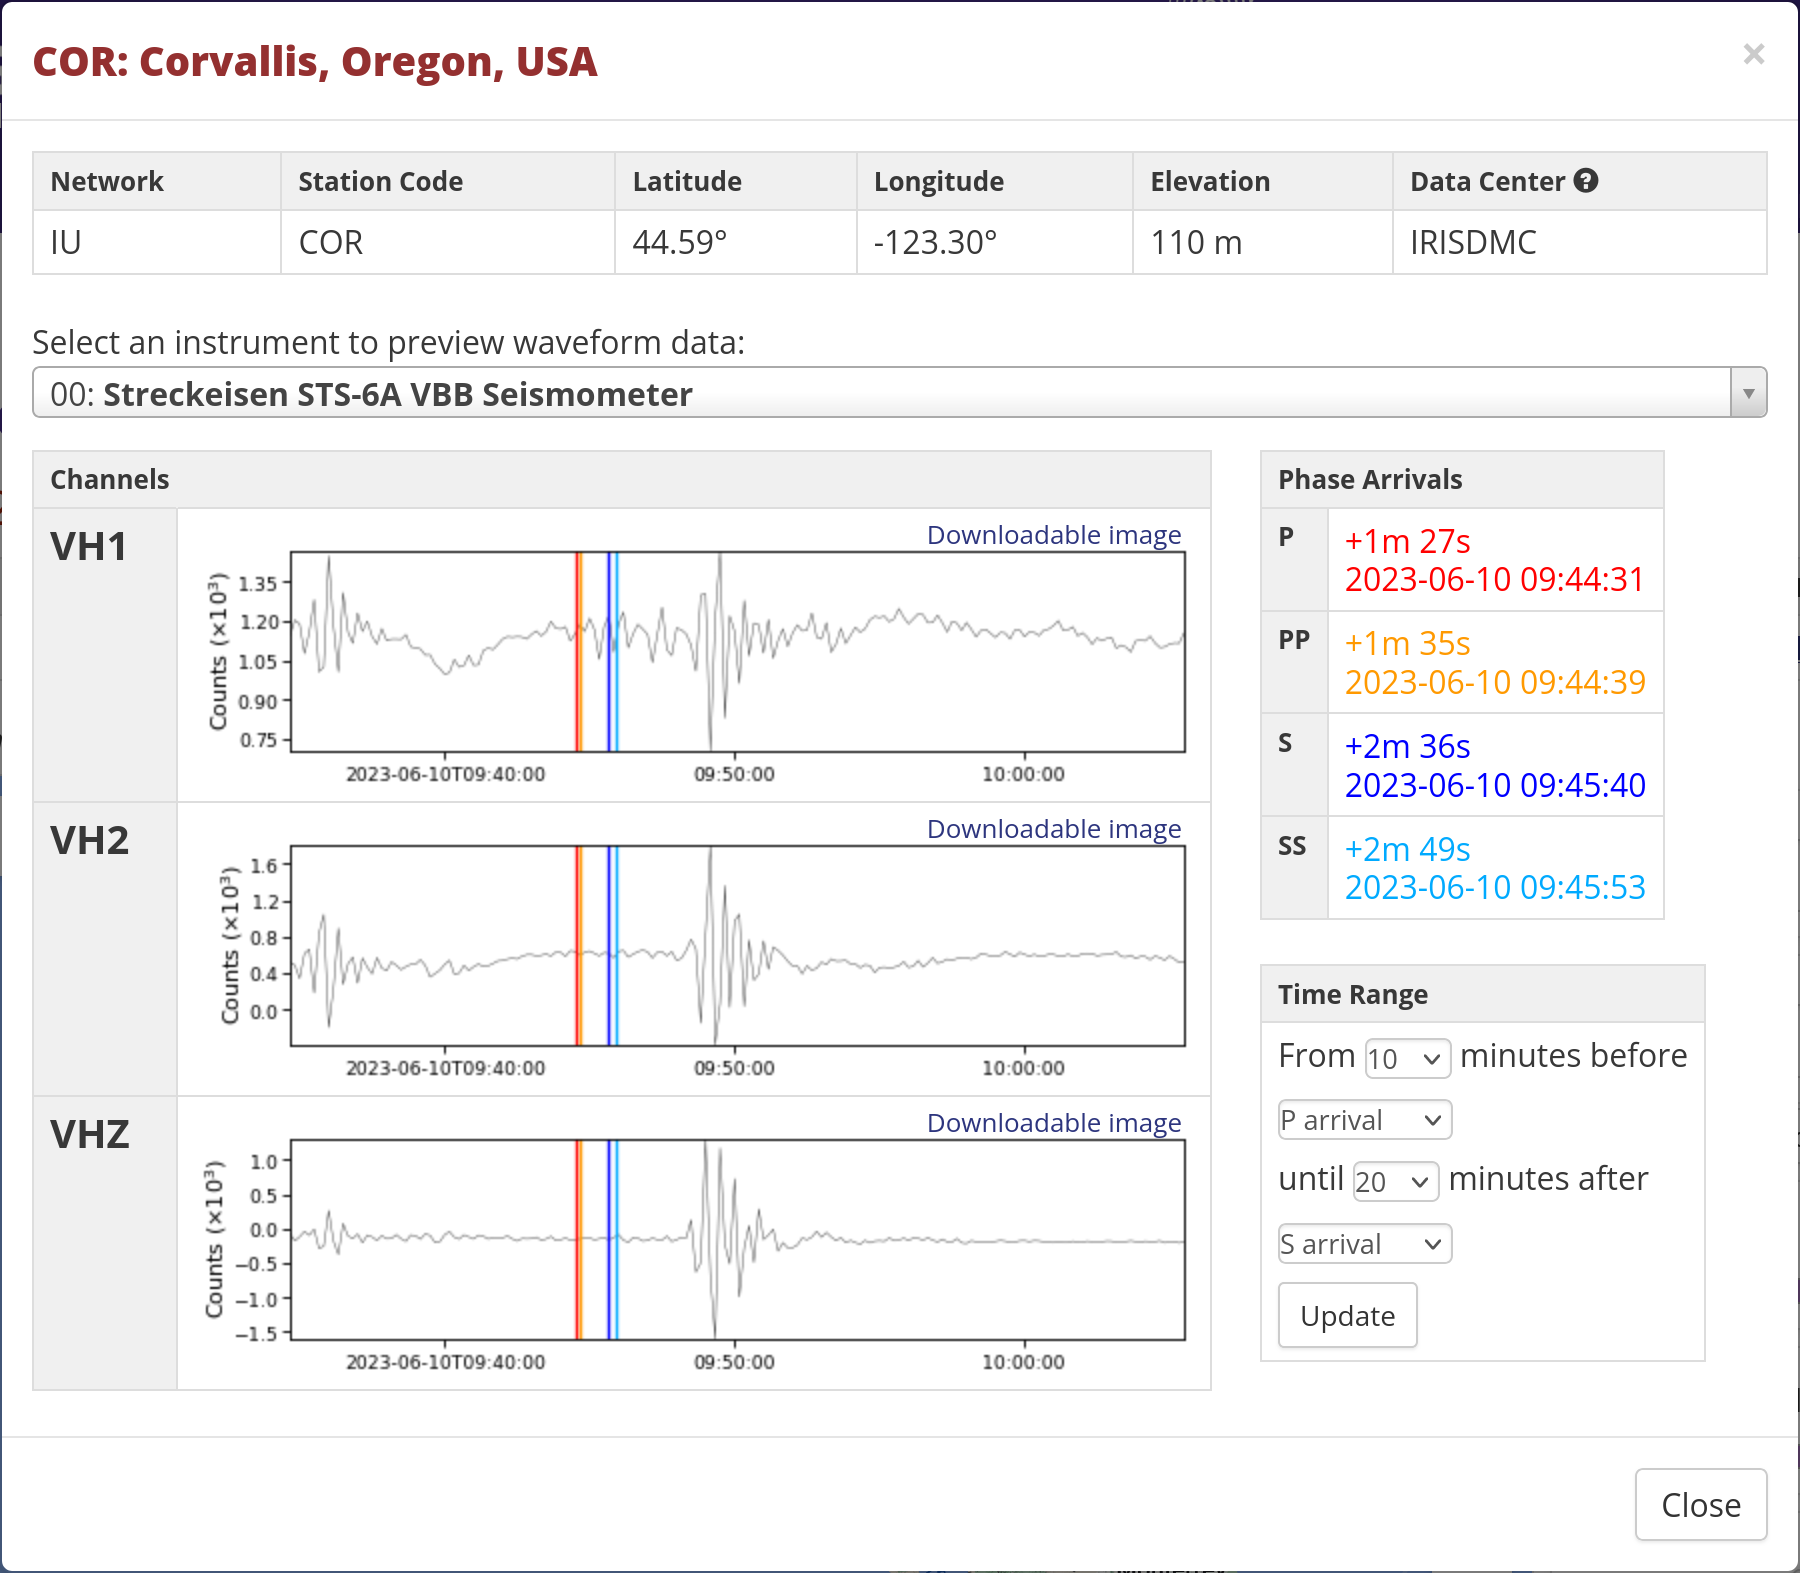
Fiji Islands Region: Mag 5.8, June 10 2023, 09:12:50 UTC
I’m curious to know that that 09:50 spike is about…but let’s keep
going. The S and SKS waves showed up pretty strongly at 09:35 or so.
Here’s what I saw:
Don’t know that that 09:28 data is, but there’s bupkiss at 09:35. Hm.
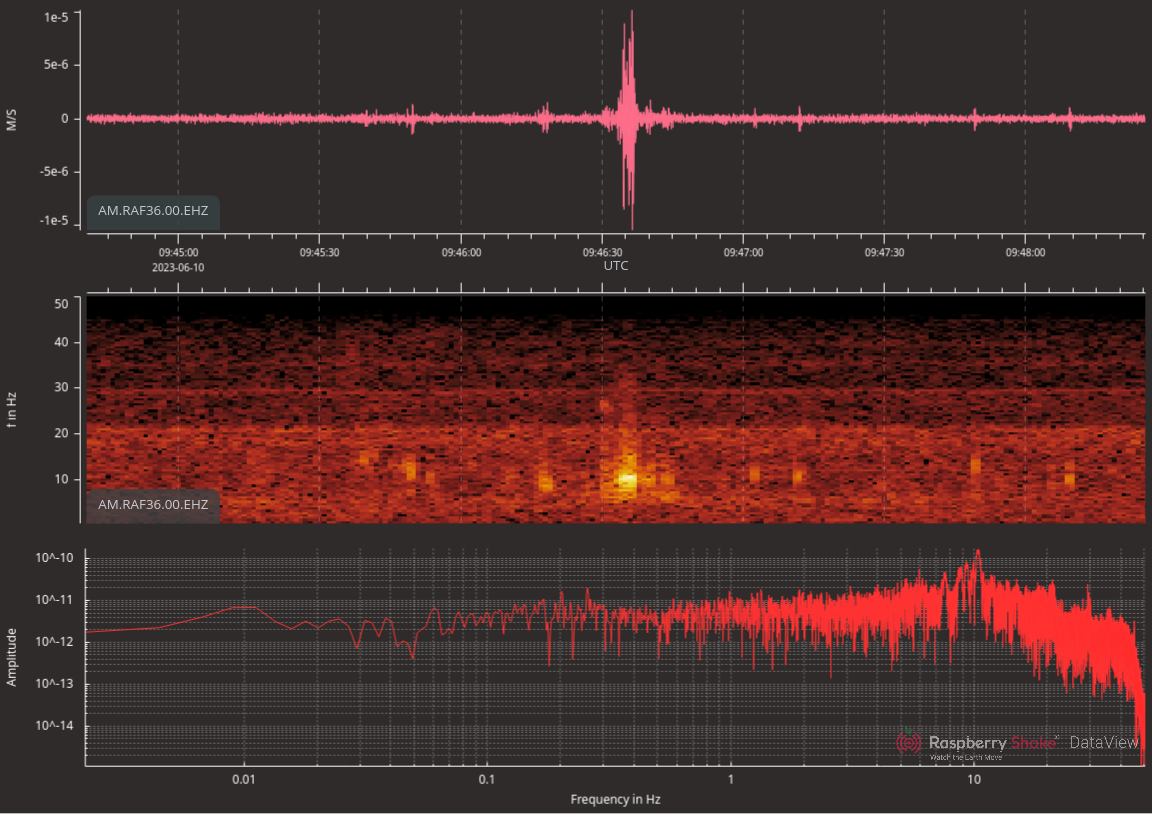
Anderson Springs, California - Mag 2.6, June 10 2023, 09:43:04 UTC
That doesn’t seem a good fit either…but: Corvallis is 652 km away
from the epicentre, and it took 90 to 170 seconds for the waves to
arrive. I’m 1164km, about 1.8x further. Again, stupid math: 90-170
seconds becomes 160 to 306 seconds, or about 2.5 - 3 minutes. And
look at what I recorded 3 minutes after that quake:
Here it is really zoomed in:
This seems like a good candidate to me!
So what next?
All this is just a first pass through the data (and a very manual one
at that).
I’d like to do more digging. Finding some way to automate at least
the collection of links & data would be wonderful.
February and March got away from me…but fair enough, because I
started my new job at a 🌠SPACE🌠COMPANY 🛰📡🤯. I’m pretty excited.
Also, though, I got COVID and then a sinus infection in March, which
sapped my energy. I got over it, but man, that was not pleasant.
So what did I do?
Hardware hacking
Continued to work on firmware for weather vane.
Climate letters
Three sets, rather than the 8 that should have been. But COVID.
Work
So much Terraform work. I’ve got the luxury of setting up the
codebase from scratch, and so far (🤞) I think I’m doing a decent
job of it.
Travelled to Edmonton for an offsite, and actually met my team in
person for the first time. I talked to almost everyone in the
company. Such an amazing bunch of people. And hey, our first
satellite is due to launch real soon now…
More progress on the weathervane. Designed a sort of skirt for the
whole assembly in FreeCAD, thanks to the FreeCAD for Makers
book by Jo Hinchcliffe, aka Concretedog (who I met at the 2017
Opensource Cubesat Workshop). Printed out a rough version
which seems like it should work; next up is a nicer version, which
looks like it should take 36 hours (!).
Tried repairing a coffeemaker that had a blown thermal fuse.
Replaced the fuse and tested it out…whereupon it promptly blew
again. 😑
Opened up the chickadee birdhouse at my in-laws’ for the season.
We’ve had some interest, which surprised me – I thought they
wouldn’t be checking out nesting spots in January.
Much writing to politicians about climate change – by my count, 96
paper letters, plus emails, phones, faxes and petitions. Target for
this year: 110.
Met with my MLA, the Honourable Jennifer Whiteside, about
climate change twice; I thank her and her staff for their time. I
definitely want to continue this.
Drove to Ontario with my family in our EV: 6 days driving there, 2
weeks to visit my parents, then about 7 days back. It all went
quite well.
A fair amount of hardware hacking: a birdhouse camera, fixing the
tipping bucket rain-o-meter in our weather station, getting
sorta-maybe-reliable CO2 readings with an MQ135 sensor, and finally
getting into ESP32s…man, those are fun; MicroPython is right up my
alley.
A lot of natural history: participated in a bioblitz; submitted 432
eBird checklists; made 1271 observations, and 876 identifications,
for iNaturalist. Goals for next year:
eBird: 450 checklists
iNaturalist: 1300 observations, 900 identifications. That’s not a
whole lot more than last year, but I did a lot of observing
during the trip to Ontario.
Continued work on my Emacs dotfiles, which has been going
since 2009. Wow.
I read 46 books.
I walked an average of 7km a day, for a total of 2,573 km. This
isn’t as much as 2021 (7.2 km/d, 2629km) – but is not bad at all
for getting COVID (Jan/Feb) and flu (November).
Began teaching myself web development.
Resigned as a core contributor for the Libre Space Foundation and
Polaris, but got a job at Wyvern Space.
First thing to mention, which doesn’t really have a category: I walked
from my home in New Westminster to UBC in one day; it was about 32km,
which is the longest walk I’ve done in one day. I am mulling the
possibility of walking across the US when I’m 60, and this is the kind
of daily distance I’d want to maintain. I got some good blisters and
was sore the next day, but not crippled; I think I could have done
that again. It’s a good sign.
More work on the weather vane; got it mounted on a peanut butter jar
lid. If that sounds silly, then in my defense it turns out to be
very handy to have a standalone mount for a project.
Made an HTML page to display readings from the weather vane, using
javascript to rotate an arrow graphic to reflect the direction it
was measuring. Surprisingly handy.
Bought an Ikea Vindriktning, aiming to read its measurements
directly with an ESP32. Took a while to figure out how to get
it working – turns out that a common ground between the ESP32 and
the sensor board was necessary to get the UART working – but I
think it’s coming along.
Took apart a coffee maker that died on us to figure out what was
wrong, and it turns out to be a thermal fuse that blew – apparently
this is quite common. Will be picking up a replacement and seeing
if I can get it going again.
After nearly 5 years of searching, I have finally got a job in the
space industry: beginning January 9th 2023, I’ll be working for
Wyvern Space. They are building satellites to do
high-resolution hyperspectral imaging; my position is senior devops
software developer, helping to build and operate their image
processing pipeline. I couldn’t be more thrilled. 😁
Tried getting habit working under mod_wsgi in Apache on my home
server. Man, this was surprisingly hard: the documentation isn’t
great, I couldn’t figure out to adjust URLs properly (serve under
/habit rather than just /), and also I suspect I’m doing things
sub-optimally. Called it quits after a while, and continued running
the Flask development server on my local network (no, not exposed to
the Internet); this is good enough for now.
Hardware hacking
Tried out using an inexpensive flow meter as an alternative
design to measure precipitation. It turns out this sort of works.
Precision is good – about four pulses per mL of water – but it
takes a fair amount of water column height to get the meter to turn.
I was able to accomplish that by using a funnel, and maybe 18" of
1/4" vinyl tubing…but if I didn’t hold it just right, the water
would just flow through the meter without actually turning the
internal vane.
On top of that, the original tipping bucket meter seems to be
behaving a lot better now that I have tightened up the screws
holding the wires that connect the meter and the rest of the
equipment.
I may try this design at home, but for now I’m setting it aside.
Trying to get back to doing these things on a regular basis.
Hardware hacking
More work on an electronic weather vane, following these
instructions. Lots of figuring out what size of bearings I
should order.
Some soldering to make a battery holder for some ESP32 camera
modules I’ve got.
Weather station:
Try to get the tipping bucket rain meter working; there’s a loose
connection somewhere, and periodically I see that Burnaby had 5
metres of rain in the last 24 hours. I never realized just how
much you have to pay attention to loose wires.
Sketch out a new rain meter based on inexpensive flow meters, then
order some. We’ll see how this works.
Webby
Going through a number of online courses/resources:
Coursera UMich Web Design for Everybody course: excellent,
though aimed at people quite new to development of any sort. One
thing: I’m lucky enough to have my employer pay for this, but the
lecturer, Colleen van Lent, writes:
My motivation for creating this course content was to spread the
mission of free education to everyone. Unfortunately, many of
the platform changes has put the material behind paywells. I
highly encourage students to take the courses individually
(rather than as a specialization) to access them for free. Even
then, some of the assignments may be hidden. I am hoping to
launch a new more open version in Fall 2018.
Trying to get the basics down, then look into React or some other
front-end framework.
Gotta say, I’m really fascinated by the tie-in between JavaScript
and DOM manipulation, which I had not really grokked before.
Project-in-progress is a refactoring (not a redesign, as I want the
look to remain about the same) of The Floating Head of Ayn
Rand, which has been more or less untouched for HOLY CRAP
twenty-one years. (State of the art at the time was
table-based layout, which I adopted enthusiastically 😬).
Changed the CSS for this site to have the post titles be a bit more
prominent:
Newest feature: adding links to the Wikipedia page for a
tree species!
Coming soon: adding common names for species (eg: English Oak
instead of Quercus robur)…which turns out to be surprisingly
tricky.
Tried pytaxize, which was a yakshave to get an NCBI API
token, then gave me problems re: rate limiting
Tried pygbif; better results, but still not great for
trees. Example: Quercus palustris is resolved to just “Oak”,
but Wikipedia clearly resolves it to “Pin Oak”.
But this gave me the idea of trying wikidata or
wikispecies; this is up next.
I’ve become interested in web development recently, and have begun
working on a habit-tracking project called, unoriginally, Habit.
Currently it’s a good exercise for becoming familiar with Javascript,
Jquery, Bootstrap, Flask and SQLAlchemy.
Hardware hacking:
I ordered a bunch of AI-Thinker ESP32 camera modules from
Universal Solder (Canadian vendor of Arduino, ESP32, electronic
components, etc; I’m a happy customer & recommend them thoroughly).
Started digging into how to make it into a timelapse camera.
Random:
I signed up for a free account with [The SDF Public Access UNIX
System][3]. I’ve got a totes-real homepage at
[http://saintaardvark.unixcab.org][4], just like the old days.
I ordered a bunch of AI-Thinker ESP32 camera modules from
Universal Solder (Canadian vendor of Arduino, ESP32, electronic
components, etc; I’m a happy customer & recommend them thoroughly).
Started playing around with them.
Some work on the electronic windvane.
Add a photocell to the office weather station so I could begin to
track light levels.
Built a map of our trip in July. This was built from GPS data
recorded along the trip; I analyzed it to find places where we
stopped, compared those places with the charger database maintained
by the US National Renewable Energy Laboratory
(https://developer.nrel.gov/docs/transportation/alt-fuel-stations-v1/),
and marked the places that matched chargers. Not the most
compelling visualization, but it’s a start.
Other:
I resigned as a Core Contributor of the Libre Space Foundation and
the Polaris project. It’s been wonderful to work with these folks,
and I wish everyone the best, but it’s time for me to move on.
More playing with ESP32. Try making an open-window detector with
the built-in Hall effect sensor, and sending a Grafana annotation
when it’s open.
Programming:
Refactor my .emacs files to use a lisp directory, and switch to
use-package rather than Cask. This is easily the longest-running
project I’ve been working on:
commit 85b1d148afdc135d725498c0384d58e7baa0866d
Author: Hugh Brown <hugh@chibi-laptop-01.(none)>
Date:   Tue Mar 3 21:13:57 2009 -0800

    New repo.
…and that commit came after declaring bankruptcy in the last one.
Tried out vgg16 as a feature finder for the birdhouse camera, and
xgboost as a classifier; 86% accuracy, which isn’t bad.
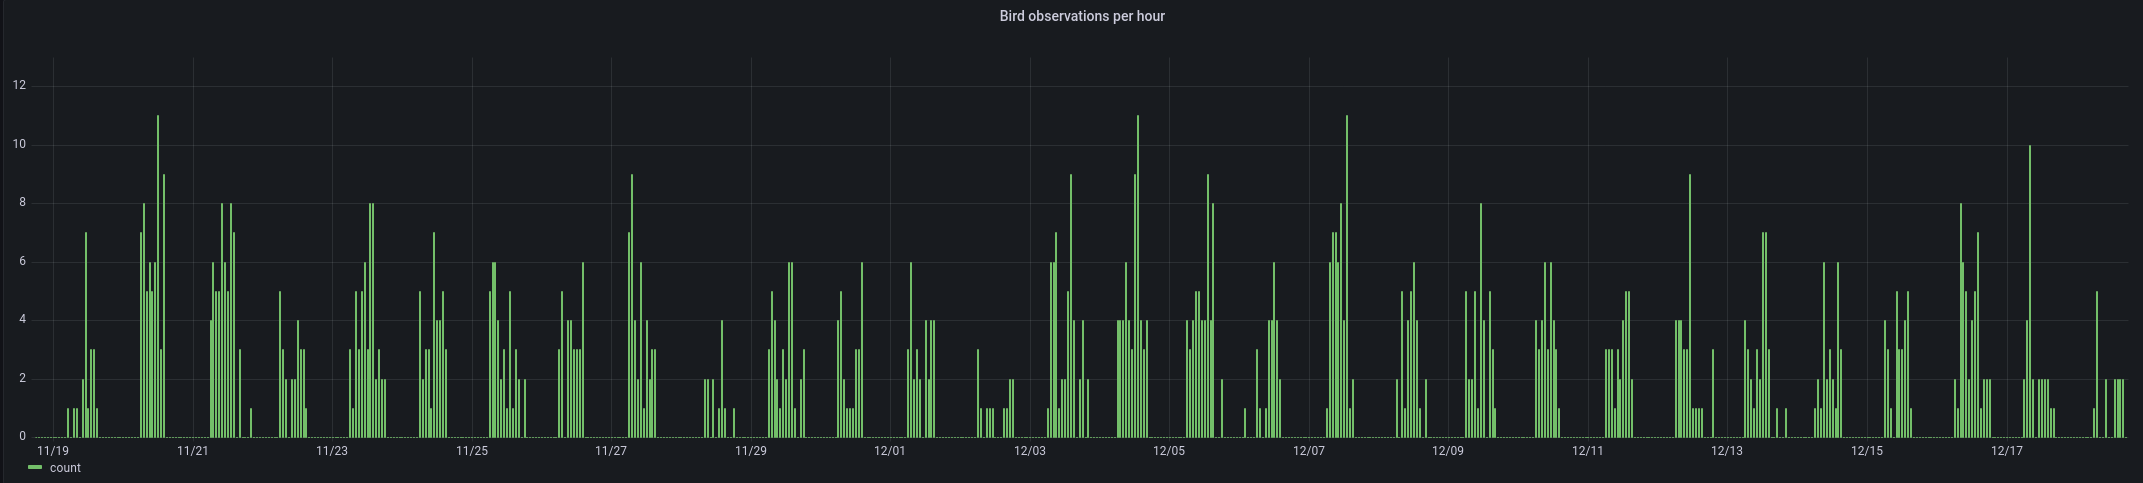
Set up BirdNET-Pi at home – very interesting project
Hardware hacking
Try setting up an MQ135 sensor prototype board and hooking it up to
a Pi. Mixed results; seemed to show 403PPM, which is at least in
the general neighbourhood. But it seems fussy, and takes a lot of
warmup time.
Ordered some ESP32 chips to play with – Lolin32 Lite from
Universal Solder (I’m a very happy customer of theirs). Took a
while to get going, but this was mainly because I didn’t realize the
USB cables I was trying it with were charging-only – or even that
that was a thing. Got MicroPythong going, and wow – wifi set up
right away, and with a decent range on it too. Amazing. Played
with MicroDot, a web framework in MicroPython that works on
ESP32. 🤯🤯🤯
Natural history
Participated in the City Bioblitz for iNaturalist & took 82
observations here in New West.
No ML/DS work this month. But I am beginning to get interested in
microscopy, so…
Hardware hacking
Does it count as hardware hacking if it’s all software? A question
for the ages. Anyhow: set up motion on the Raspberry Pi running
the birdhouse camera. Set up a cron job on the Pi to copy the
captured movies back to my home machine. Set up a cron job on my
home machine to make a gallery out of it using PiGallery 2,
which is just what the doctor ordered.
The weather station had been saying for a while that my in-laws'
place was getting 14m of rain per day, which seemed excessive. Took
a look at that, and broke readings from the anemometer as
well. (╯°□°)╯︵ ┻━┻ Dug more and discovered that the connector
between those two pieces of equipment and the Cat5 cable (ask your
parents, kids) had rusted. Soldered up a replacement and we were
back in business.
A friend of mine (hi Matt!) gave me an OBD bluetooth dongle to try
on the car. I spent a truly stupid amount of time trying to query
it with Python, which led me into Bluetooth Hell. I love Linux but
OMG sometimes it’s the worst.
Set up an MQ135 to try and read CO2 levels at home. Getting mixed
results, which seems to be par for the course. A collection of
links in no particular order:
I turned 50 in February. Two months later, I’m still confused by
this. Was still recovering from COVID.
Hardware hacking
Started work on a birdhouse camera with my father-in-law. He built
the birdhouse in December; this month we finally started working on
putting together the camera part. There are two in here: an
infrared camera and an endoscope for visual light. I put together a
little circuit board with 6 500mW IR LEDs to act as illumination.
Home sysadmin
My little home machine is a Zotac ZBOX CI320 nano purchased
in 2015. It’s great – small, unobtrusive, passively cooled and
enough for everything I need…except that the 4GB of memory it has,
which felt so decadent, is starting to be a constraint. I blame
InfluxDB. Anyhow, ordered some more RAM only to realize I’d ordered
the wrong size. Made up for it by adding a swap file. Ask your
parents, kids.
Climate emergency
Met with my MLA, Judy Darcy, again about climate change; she got us
some time with MLA George Heyman, BC’s Minister of the Environment
as well. I’m grateful to both for their time.
Welp…this took a long time to write up. In my defense, I got COVID
in January and that sort of threw me off for a couple months. But
it’s also just taken me a while to get back to it. Anyhow, onward!
Machine learning/data science
I submitted my entry to the Data Driven Cloud Cover
Competition! Aaaaand…my score was terrible. However, I got a
lot of practice out of this, and it was valuable for that. I
intended to go back and figure out exactly why my scores were so
abysmal, but got derailed (see first paragraph). But I think that
for whatever reason, my GAN was just not working at all. I need
to get more practice with this technique.
Some volunteer work for a local environmental society to demonstrate
how to use Pandas for graphing.
Climate emergency
More letters to politicians. Did not make every week, but I’m
cutting myself some slack here.
Much work on machine learning and data science: the dishwasher
loading critic, some Kaggle courses, mapping New Westminster trees.
A lot of work on Polaris: telemetry analyses, supervising our
third co-op student, and a proposal to run code on an ESA satellite
(sadly, denied).
Radio took a bit of a backseat by the end of the year.
I was asked to be an advisor for ALEASAT, and that was
wonderful.
The heat wave scared me, and I turned that into a focus on
climate activism. Small steps, but I’m taking them. Met with my
MLA in November to discuss climate change. I think of this as being
the start of about 30 years of work.
Total distance walked since getting my latest phone in January 2018:
8,664 km. Daily average distance in 2021 was 7.2 km, up from last
year (6.4 km).
Got more into birdwatching, phenology and natural history. Lots of
data taking, which I enjoy.
Bird feeder camera with ML to recognize the birds. Does a fairly
crappy job of picking out species but a good job of detecting birds.
Entered a couple of ML contests – no wins, but that’s expected;
it’s the practice I’m after.
At work: joined a new team which has a definite data science focus.
Learning a lot.
I’m leaving out all the incredibly important time with my family; this
isn’t the venue I choose to record that in.
There were a lot of things I had to change (because the code was
designed for the author’s problem, not mine) and fix (because the
code did not always work as described); I plan on submitting the
fixes back to the author, or at least letting them know about them.
This was done on two different machines. The first is a Fedora
server I have at home, an Intel NUC with 16 GB of memory. It
doesn’t have a GPU or a GUI (all text Emacs on this one), but it
works pretty well. It’s got more memory free than my laptop (which
also has 16GB but also runs browsers), and enough disk space that I
don’t need to think about it too much. This worked well for…let’s
call it minute-to-minute development: working in my editor, banging
on bugs and adding the features I wanted, committing to git and
pushing to the remote repo.
The training was all done on Microsoft’s Planetary Computer
platform, which gives me access to JupyterLab and a GPU. It has a
lot less disk space (~40GB or so, compared to ~500GB at home), no
Emacs 🤯 and no make, but it does have git and vim. My
workflow was usually to commit at home, push to git, then pull in
Jupyterlab. This was almost all in the shell, btw; the code I’m
working with was all regular Python modules, not Jupyter notebooks.
There were some times when a notebook would have been handy, but so
far I’m finding it hard to switch easily between the two – figuring
out easy ways to duplicate the parts of main() I want seems
non-trivial. Overall, this workflow worked pretty well for me.
As for Planetary Computer: it’s had some hiccups, but overall I’ve
been quite satisfied. This is a free trial, given because they’re
sponsoring this competition. Disk space is a constraint, but for a
free account I can’t really complain. And it continues to be
wonderful – and shocking – to see Microsoft embrace Free Software
in this way. No, they haven’t open-sourced Windows, but this still
feels like pigs flying.
With Xmas and family being the focus of the month, this took up most
of my hobby time.
Home sysadmin
Upgrade servers to Debian 12. A bit tedious, but painless. Bless
Debian and all who work on it.
Hardware hacking
The endoscopes I ordered last month came in, so I played with
those a bit. I think they should do for the birdhouse project,
though low light may be a problem. Set up a burner Android phone to
get the streaming application working, which was fine if still
sketchy-looking AF. It also works well enough over USB, though with
an interesting lag that kicks in if there’s too much change in the
picture – for example, if you wave it around a lot, rather than
just keeping it focused on a smaller area.
This month, I actually got to meet with Jennifer Whiteside, my MLA
and BC’s Minister of Education, about natural gas
fracking in BC. I was there with two other folks from New
Westminster, and I think it went fairly well. She agreed to meet
with us again in a few months.
Lots of letters.
Hardware hacking:
First graph for the birbcam! We’re posting data to InfluxDB, so I
get to play with it in Grafana (see below). Lots more to do, but this is a good start.
Ordered a couple wifi endoscopes for the next project: a birdhouse camera.
The tipping bucket precipitation meter that’s part of the weather
station will sometimes record a lot of tips in a very short
time…like, a ridiculous number. I’ve tried various things to
filter out spurious signals, but we still see them from time to
time. This time, I tried setting a threshold in the graph –
exclude measurements with more than 5 tips in a 30 second period.
This brings things down to a sane level. Thing is, after
experimentation it is possible to have about a tip per second or
so – but that requires literally pouring water into the funnel
constantly to keep it full, and even in the midst of this I
don’t think we were getting that much rain.
Worked on visualizing data for Russet, a project I’ve let languish
for a while. The goal was to take pictures out my office window,
which faces a lot of trees (mix of deciduous & conifers), and try to
see if I could track changes in the average colour over time. The
result – just a first pass – is a half-hour animated bar
chart. It’s definitely interesting to see the change over the
course of hours, days and months. But it is also a half hour bar
chart. Lots of room for improvement.
Natural History
Observations & IDs for iNaturalist, observations for Nature’s
Notebook. I’m still managing to find new things to look at.
More letters each week, but now with a reply from the BC environment
minister now that the update to BC’s climate plan has come out.
Lots of reading through that and figuring out how I feel about it.
More asking my MLA (who’s the education minister) for a meeting to
talk about fracking. No response.
Attended a protest for the first time since university. Felt
awkward…but if that’s the worst, I’ll keep doing this.
Hardware hacking
Playing with a TM1638 module I ordered.
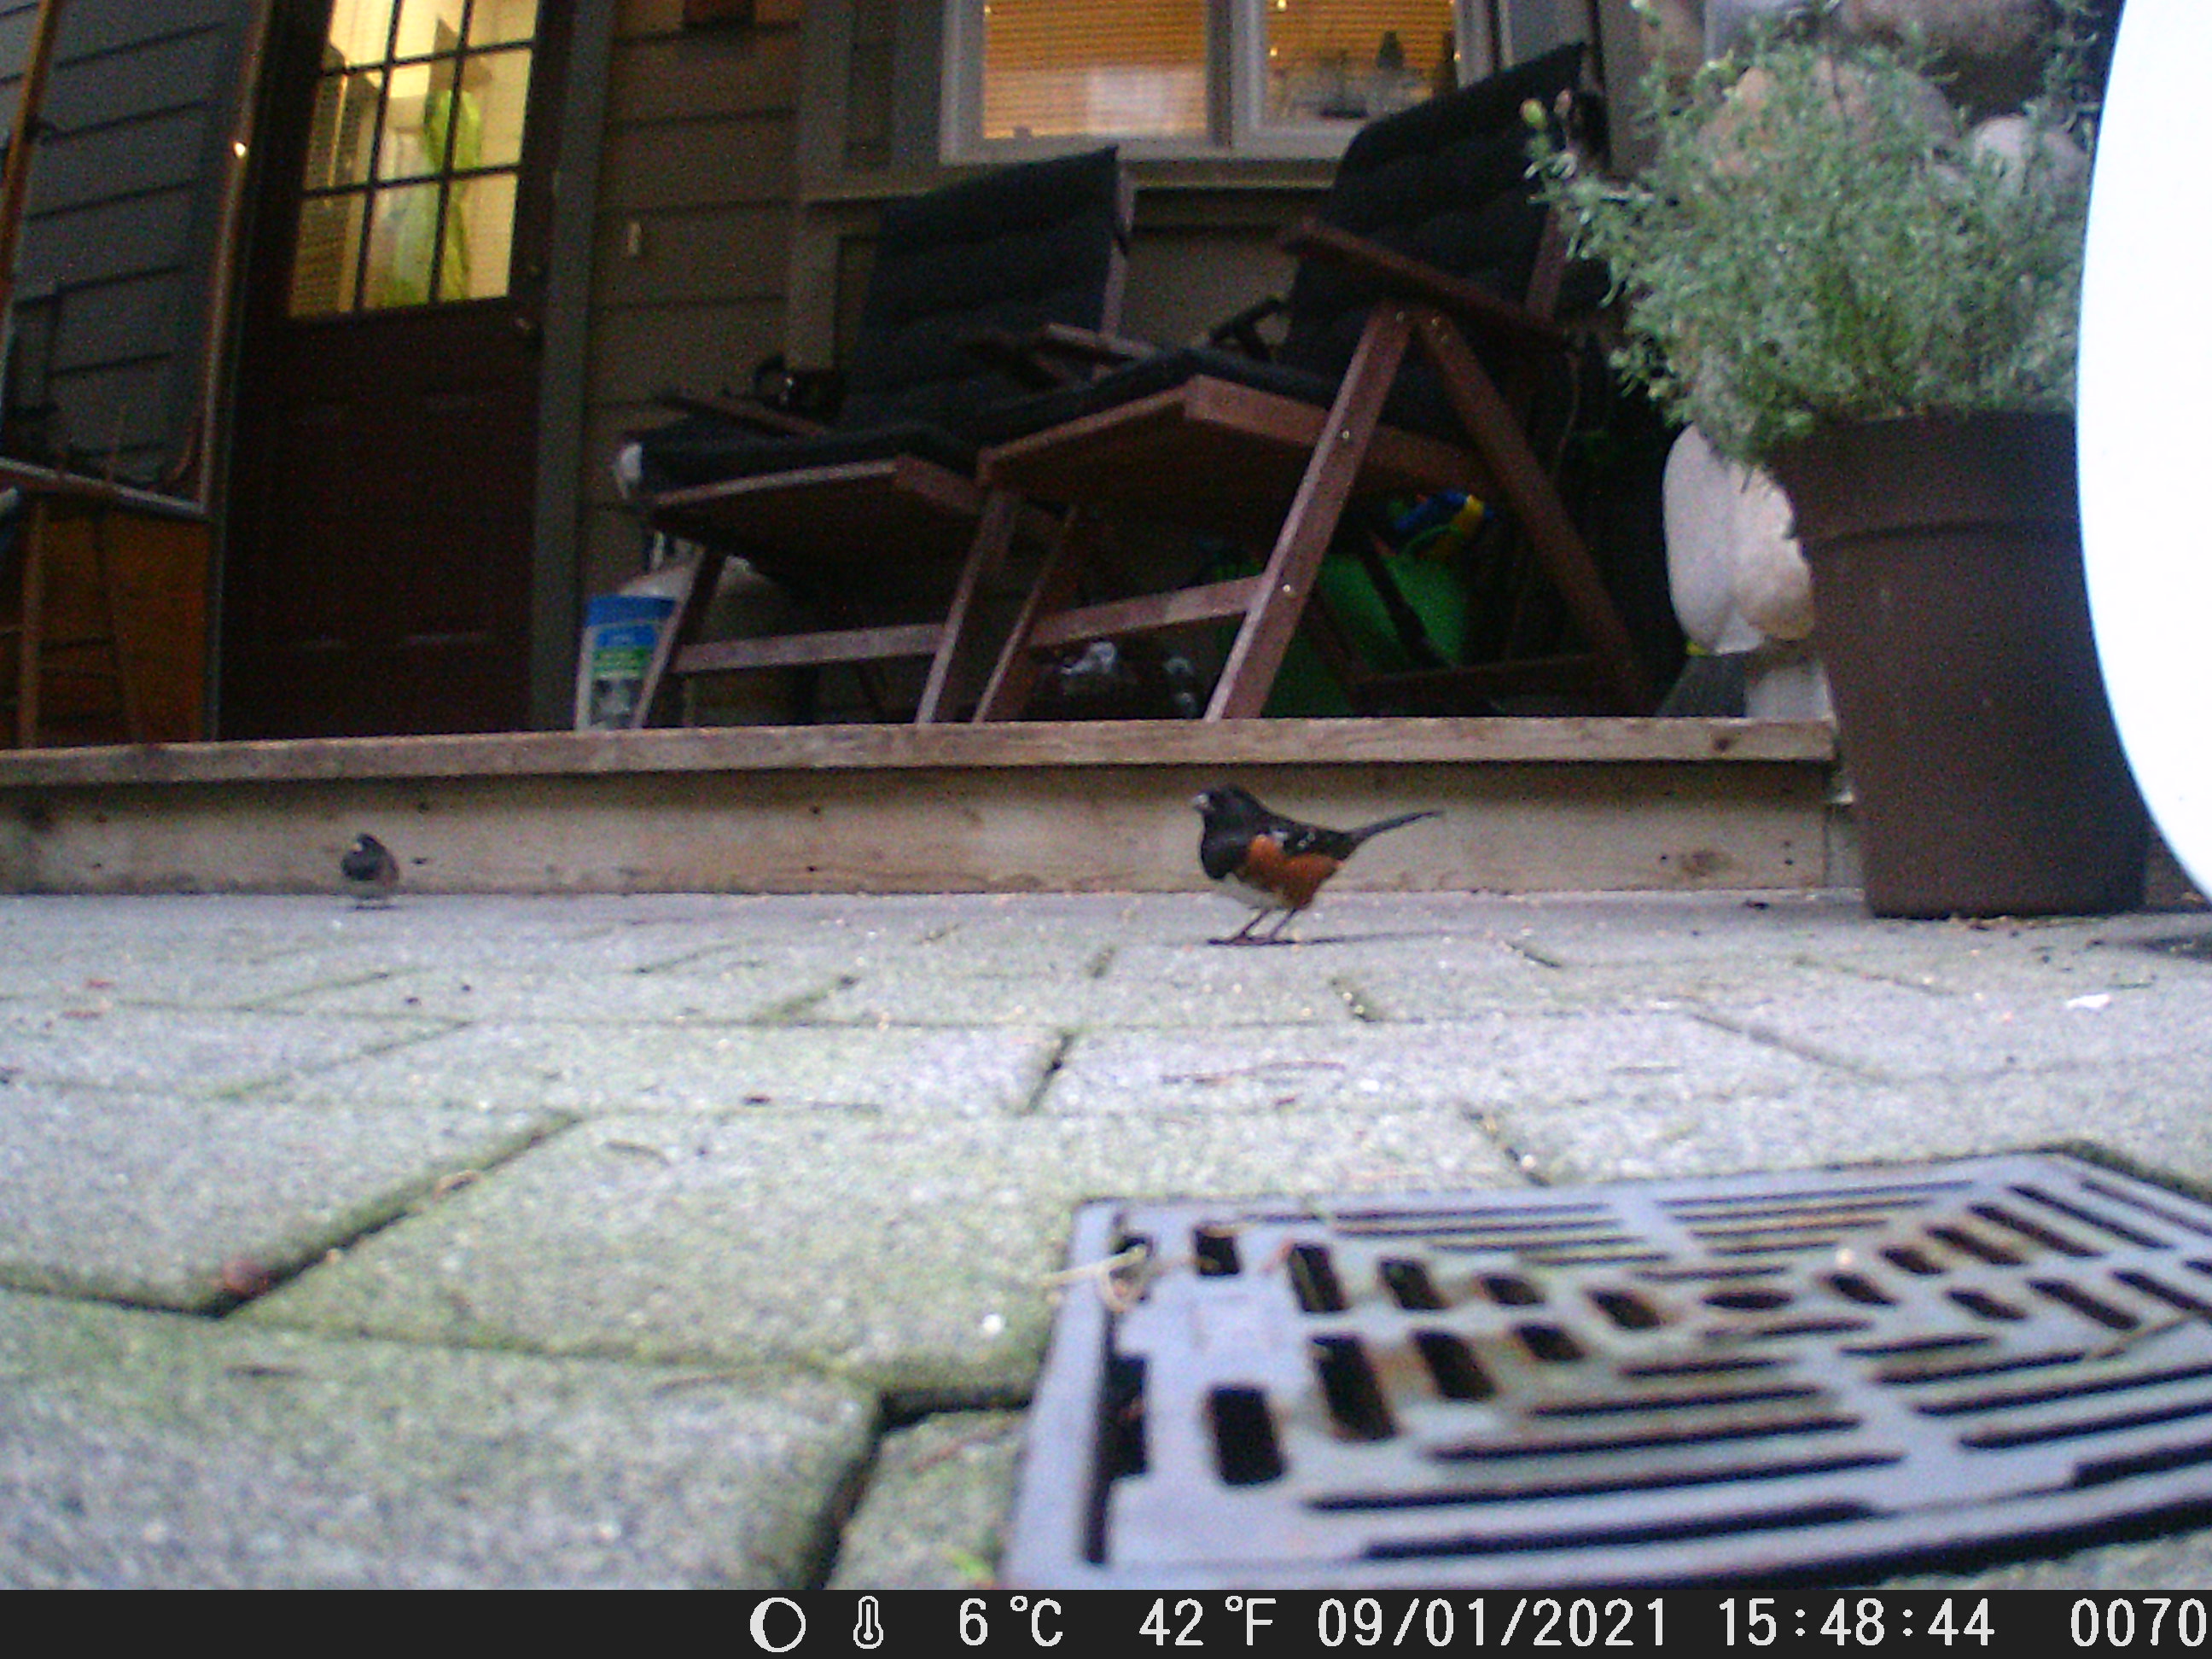
BIRBCAM! Set up cheap binoculars so that they’re focused on a bird
feeder at my in-laws’ house; set up a webcam behind them; get the
Coral dev board connected to their wifi; get Motion running on it;
and get Motion taking pictures, then getting an example script to
analyze the pictures post-hoc. The identification is a little all
over the map, but as a bird detector it works great. Pic can be
found here.
I ordered a handheld anemometer a while back; it arrived, and I
realized it did Bluetooth. That led me down the path of trying to
decode the packets, rather than install the dodgy-looking app that
I’m sure is totally fine, not even a problem Still not figured out
My wife and I were out at the Coquitlam River Park today, walking
along the trails. We hadn’t been there before, and it was amazing to
see the river flow. It was fast, and it was easy to imagine the bad
things that would happen if it flooded.
On our way back, we crossed Patricia Bridge, a small footbridge
that took us back to where we’d parked. For fun, I decided to try
guestimating the river flow, and then see if I could find actual data
on it once we got home. I figured I probably wouldn’t be terribly
accurate, but it would be interesting to see how wrong I was – and
maybe why.
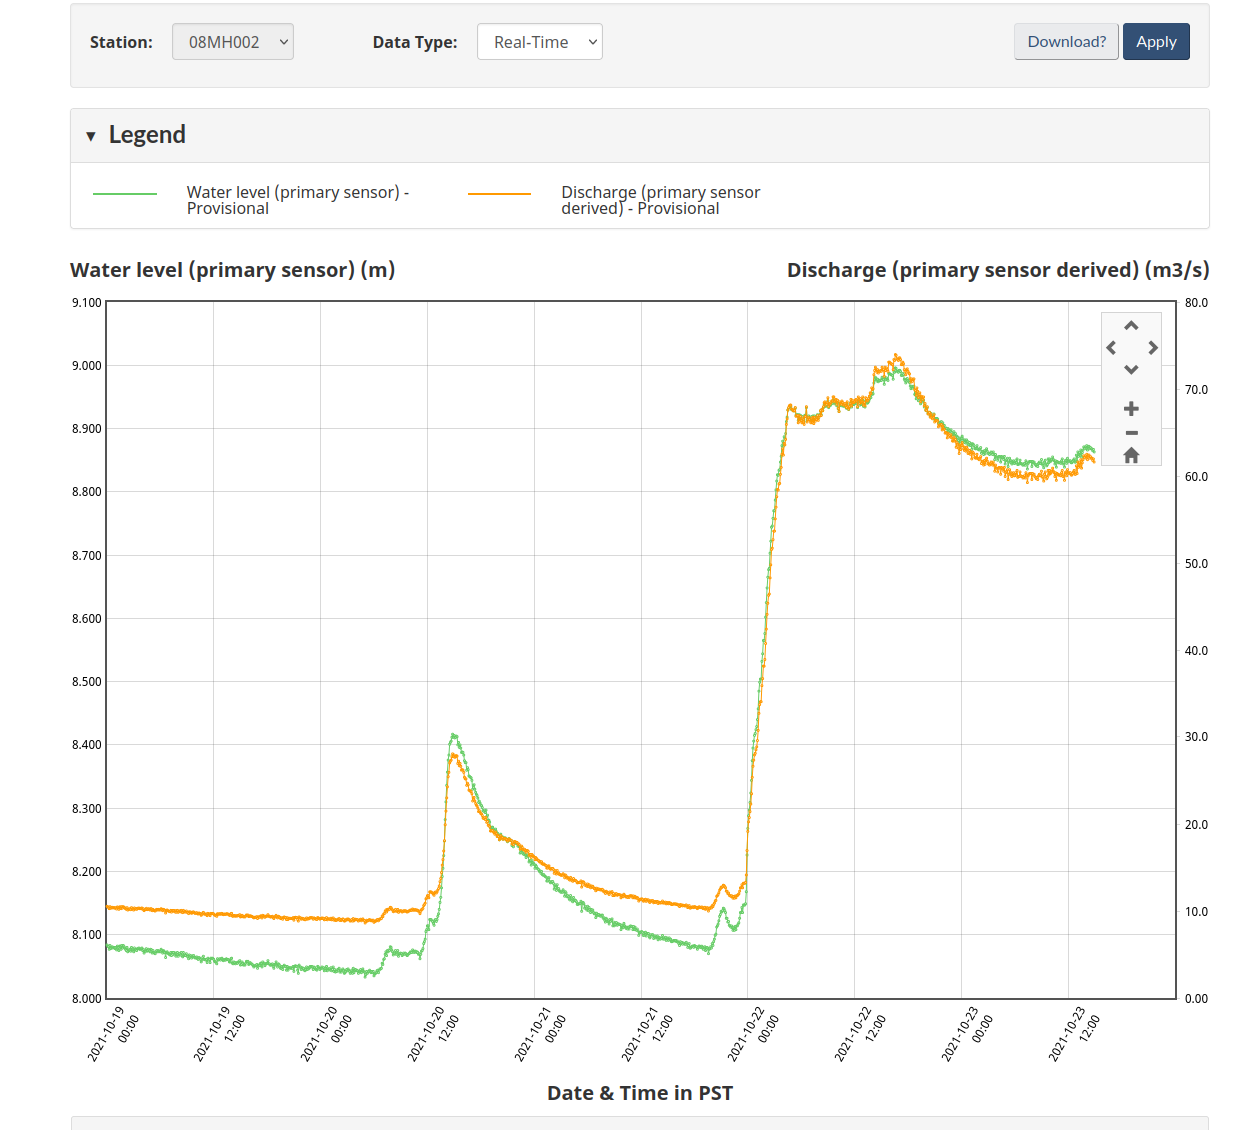
By dropping a stick in the river & watching it go, I estimated that
the water speed was something like 2 metres/second (at least, near the
bank). By pacing out the footbridge, I estimated the width to be 30
metres. I had no clue about the depth of the water, so I decided to
call it 5 metres; similarly, to simplify things I decided to assume an
oblique triangular profile for the river bottom. That gave me a
surface area of 75 m^2 (that is, of the face of water from the bottom of
the river to the top); assuming 2m/s, that gave me a volume of 150
m^3/s.
The damn tooltip doesn’t show up in the screenshot, but it read 62.3
m^3/s at 2:15 PM PDT – right about when I was pacing off the breadth of
the river. That puts me off by about 2.5X. I was hoping to be closer
than that!
So what did I have wrong? Well, the depth – which the same graph
shows as 8.871 metres at the same time. That doesn’t help my model
any…that would make my volume about 266 m^3/s.
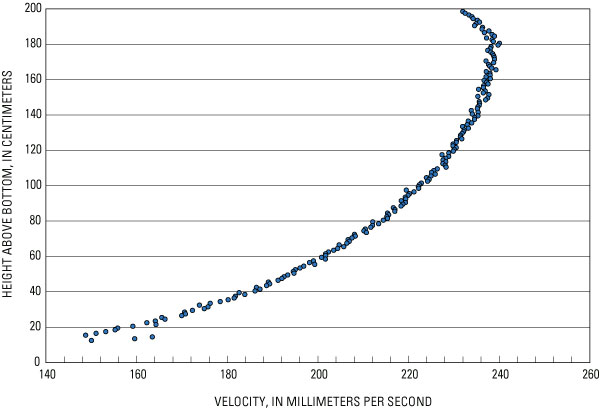
What about flow? My model assumes that water flow is the same from
top to bottom; is that correct? Probably not! (Incidentally, I
didn’t know that ResearchGate had its own StackExchange-like Q&A
feature…) The linked paper has this graph:
I was hoping to get a rough-and-ready formula to figure out the
average velocity distribution, but that didn’t come up in my very
quick, not terribly attentive reading. I wonder if I could just use a
multiplier of 0.4 (my estimate vs what the readings were) as an
empirical heuristic?
Also…as far as the big surge in data goes, my assumption is that the
dam that’s upstream released a bunch of water, given the very sharp
rise that occurred right at midnight. Still digging into that.
Entered the STAC Overflow (get it?) contest. I managed to go
through three iterations of my model, and improve a bit over the
baseline model they had as a tutorial. I finished in 71st place out
of 664 – not bad! However, my final score (0.5314) was nowhere
near the winners; the top four were all over 0.8. Still, this was
a good exercise.
More fan runtime experiments. It’s interesting to see the different
battery behaviours.
Got the anemometer hooked up to the weather station and working at
last! 🎉 The one thing it’s not is calibrated – so I’ve got RPM,
but I don’t know what that translates to in wind speed. Yes, you
can calculate the circumference of one rotation & figure it out from
there, but…well, it’s complicated.
This also required rejigging the cable on the tipping bucket rain
meter to use the same cat6 cable I used for the anemometer. Twisted
pair cabling, people, it’s the bomb.
Big refactoring of the Arduino code for the weather station; it’s
a lot more readable now. And I’m reasonably confident that my
floating point math is probably okay.
Begin plans for a bird feeder camera. I’ve got some Coral dev
boards, and it turns out the example code for it includes a bird
species recognition model based on iNaturalist data. Bought a cheap
pair of binoculars to try using as a telephoto lens for a webcam.
Nature/science:
Continuing phenology measurements for Nature’s Notebook.
Lots of observations for iNaturalist and eBird, including submitting
some historical bird counts from the past year.
After a lot of looking around, I bought two big hardcover sketch
books to use as phenology/nature journals: one page per day, and
observations from each year on that page.
Climate emergency:
Letters every week to government: mostly provincial because of the
election, but federal too once that finished.
Paying more attention to the election than last time. Holy hell,
the infighting in the Green party. Asked our Conservative party
candidate why she didn’t bother showing up to a climate debate.
(Hardly a surprise, as the Conservative candidates in my riding
haven’t shown up to any of them over the years.)
Participated in Kaggle’s 30 Days of Machine Learning
course/contest. Some of it was stuff I already knew, but it was a
good prod to do a bit of ML (nearly) every day.
Automated importing walking data from my phone. Since I’ve got an
iPhone (sigh) and Linux, this means exporting data from the Health
app, emailing it to myself, then processing it with Python to add it
to InfluxDB with the help of this repo. Since I got my phone
in 2018, I’ve walked about 7,650 km – here to St John’s,
Newfoundland is only 6,800 km.
Also automated importing air quality data downloaded from the BC
government.
As I mentioned last month, I began some experiments to track the
running time of some battery-powered fans – some with batteries
built in, some that rely on external batteries through USB
connections. I got one of the ubiquitous USB voltage meters,
and it’s perfect for this.
Began monitoring sound levels in my office with a Raspberry Pi and
the Seeed ReSpeaker 2-mic hat. It would have been really good
to get this working before the pandemic hit, because I think it
would have demonstrated the change in traffic noise due to the
pandemic…but better late than never.
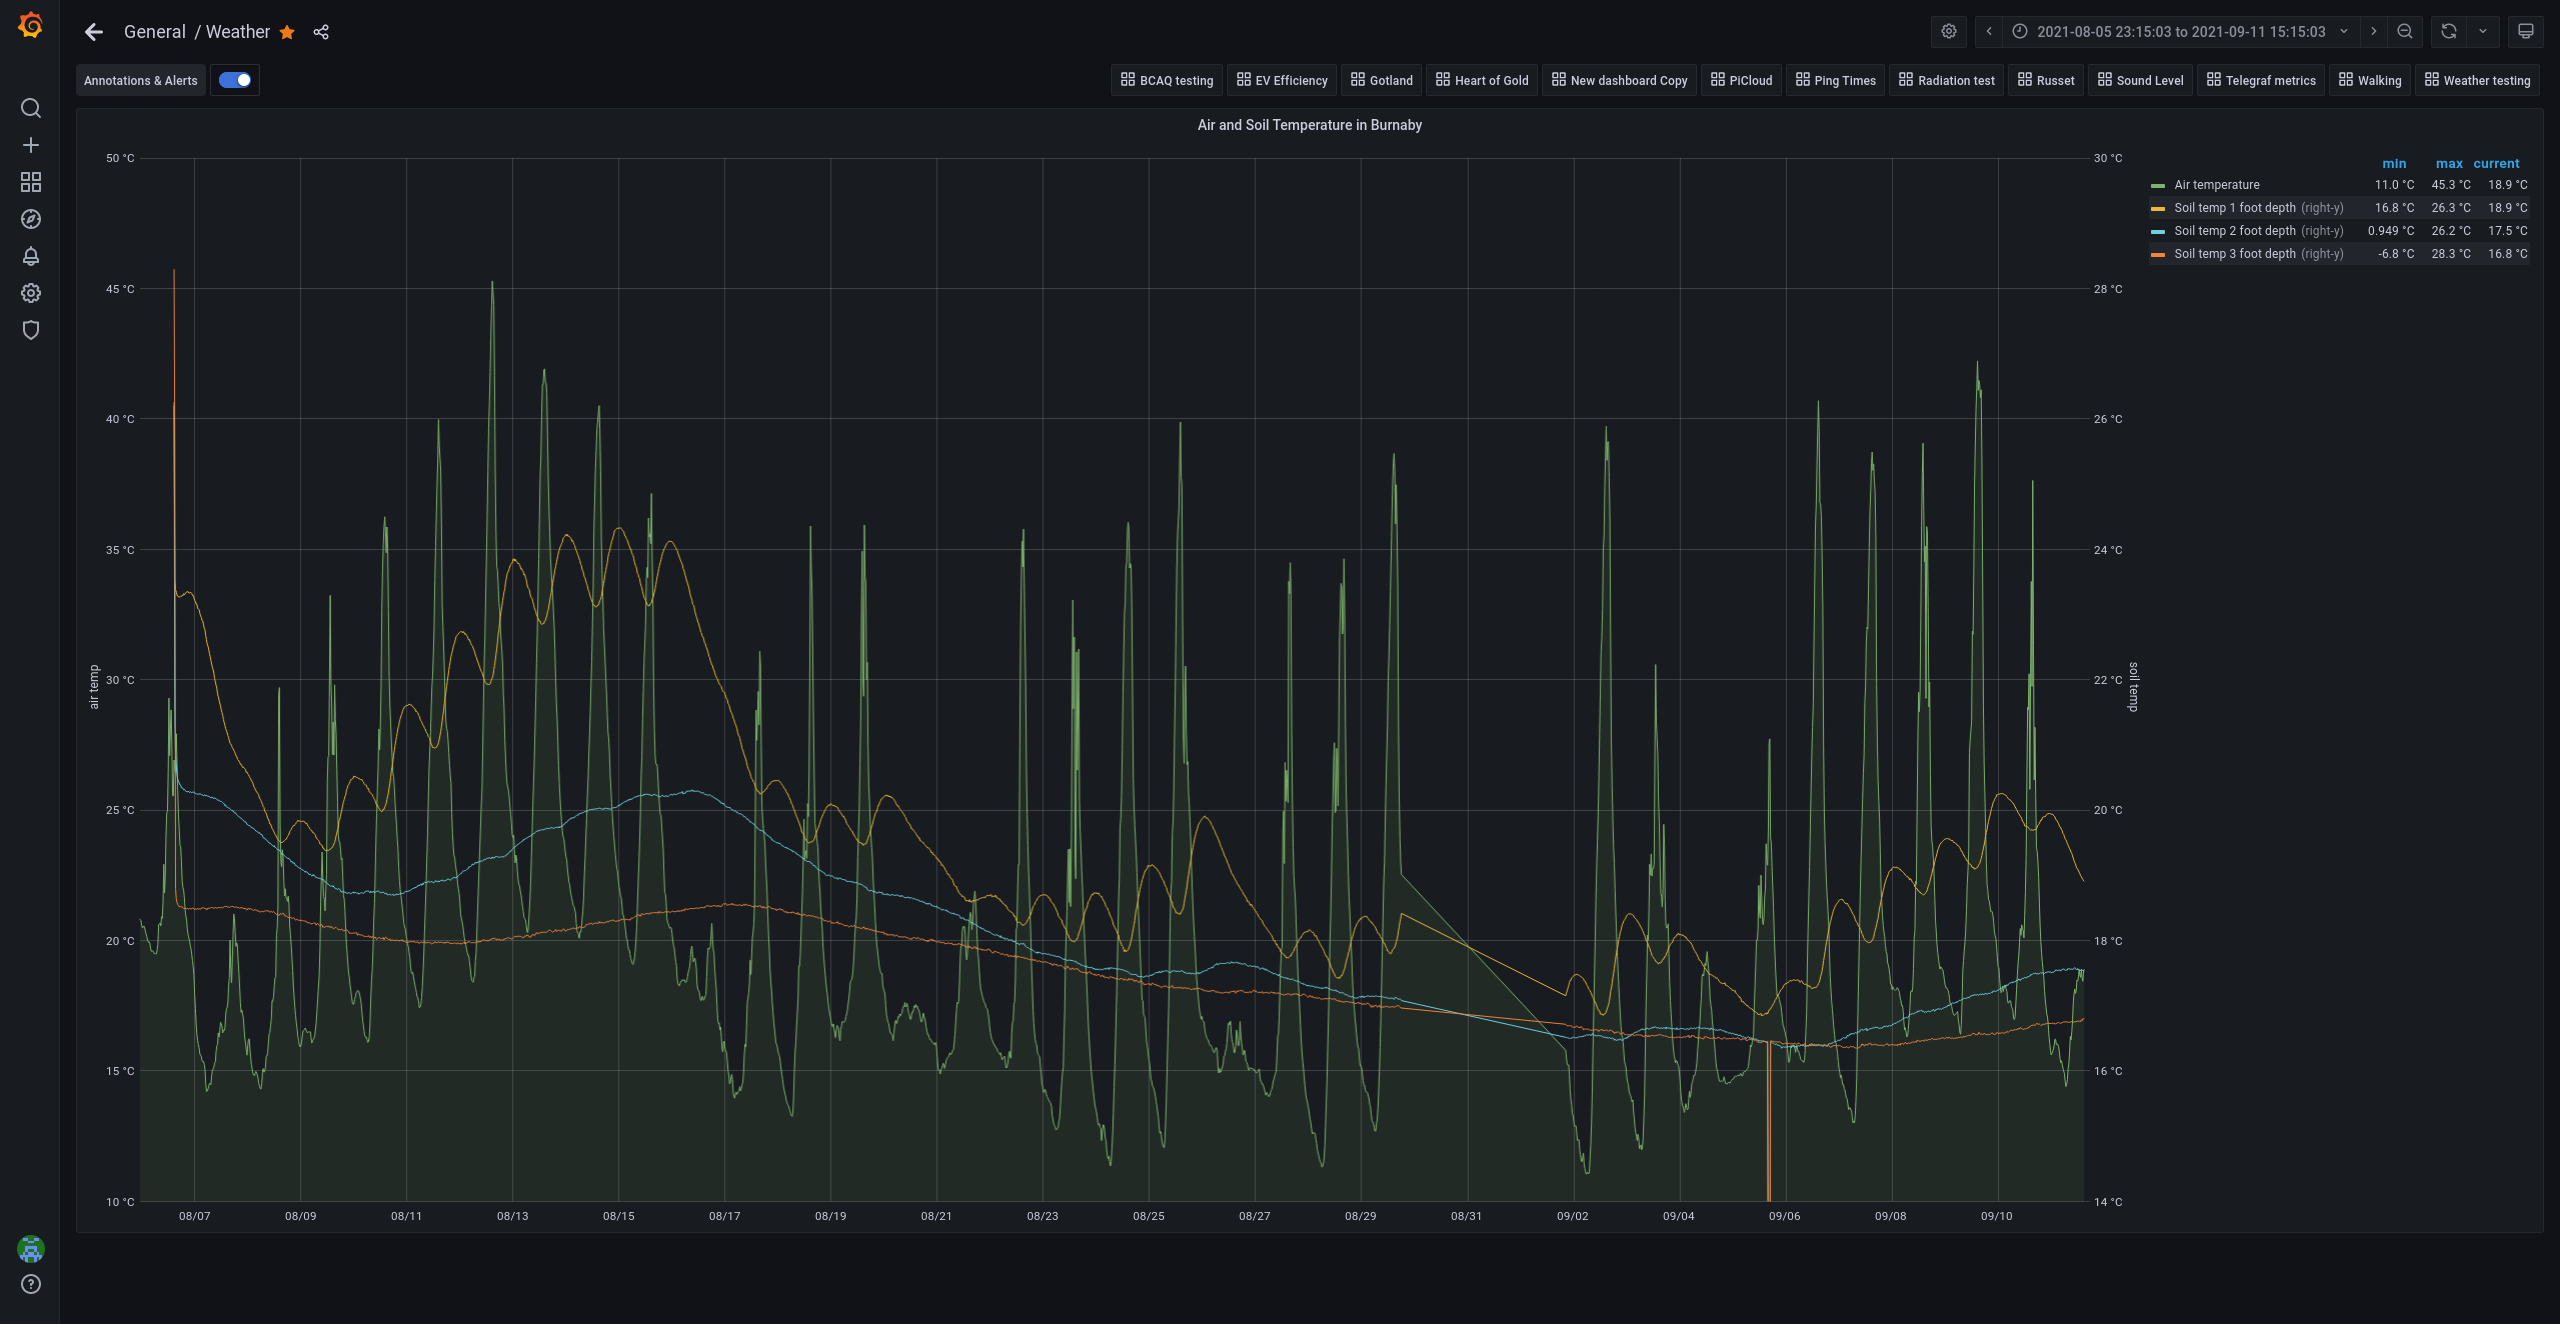
Finally added soil temperature probes to my father-in-law’s garden.
We’ve got three at different depths: 1 foot down, 2 feet, and 3
feet. The trends so far have been pretty cool:
Note the dual scales – air temp (green shaded line) on the left,
soil temp (yellow/blue/orange) on the right. Fascinating to see how
the change in temperature is buffered at different depths.
Mapping/GIS
More GIS podcasts/courses.
I made a dirt-simple Arduino GPS logger that used a small GPS module
I got as a gift from my father, and managed to map the results.
I fired up a long-dormant account on OpenStreetMap.org and
added a bunch of little free libraries (“public bookshelves” is the
tag OSM uses). Fun to do.
More work on the weather station to accommodate the one-wire sensors
intended for the ground, and to prepare for the anemometer that’s
been built. I think we’re going to skip calibrating the anemometer,
and just record RPM.
Set up (finally!) a sound card hat for the Pi to catch ambient noise
levels in my home office; we’re right by a major road, so my hope is
that this will let me track traffic levels by proxy. I’d thought
about this when COVID hit, but didn’t get on this for a long time.
Polaris
Helping out Ayush Bansal, our Google Summer of Code student; his
final report will be coming out any moment, and I’ll mention that in
(checks watch) 7 days.
ESA turned down our proposal to run code on OPS-SAT :-(, but another
Libre Space Foundation project got accepted. :-)
Mapping
More listening to GIS podcasts and courses.
More work on the tree map, including trying to get Bootstrap
working. I think this was a bit ambitious for me, though – I need
a much better foundation in the basics of web development.
First work on the dishwasher loading critic project in a while
Upgrade Paperspace to a paid account (which I still haven’t used
very much 😬)
EV
First road trip, to see what it’s like to drive longer distances.
This was only about 270km round trip, but it was illuminating.
Props to the fast charging station in Chilliwack at City Hall.
Climate Emergency
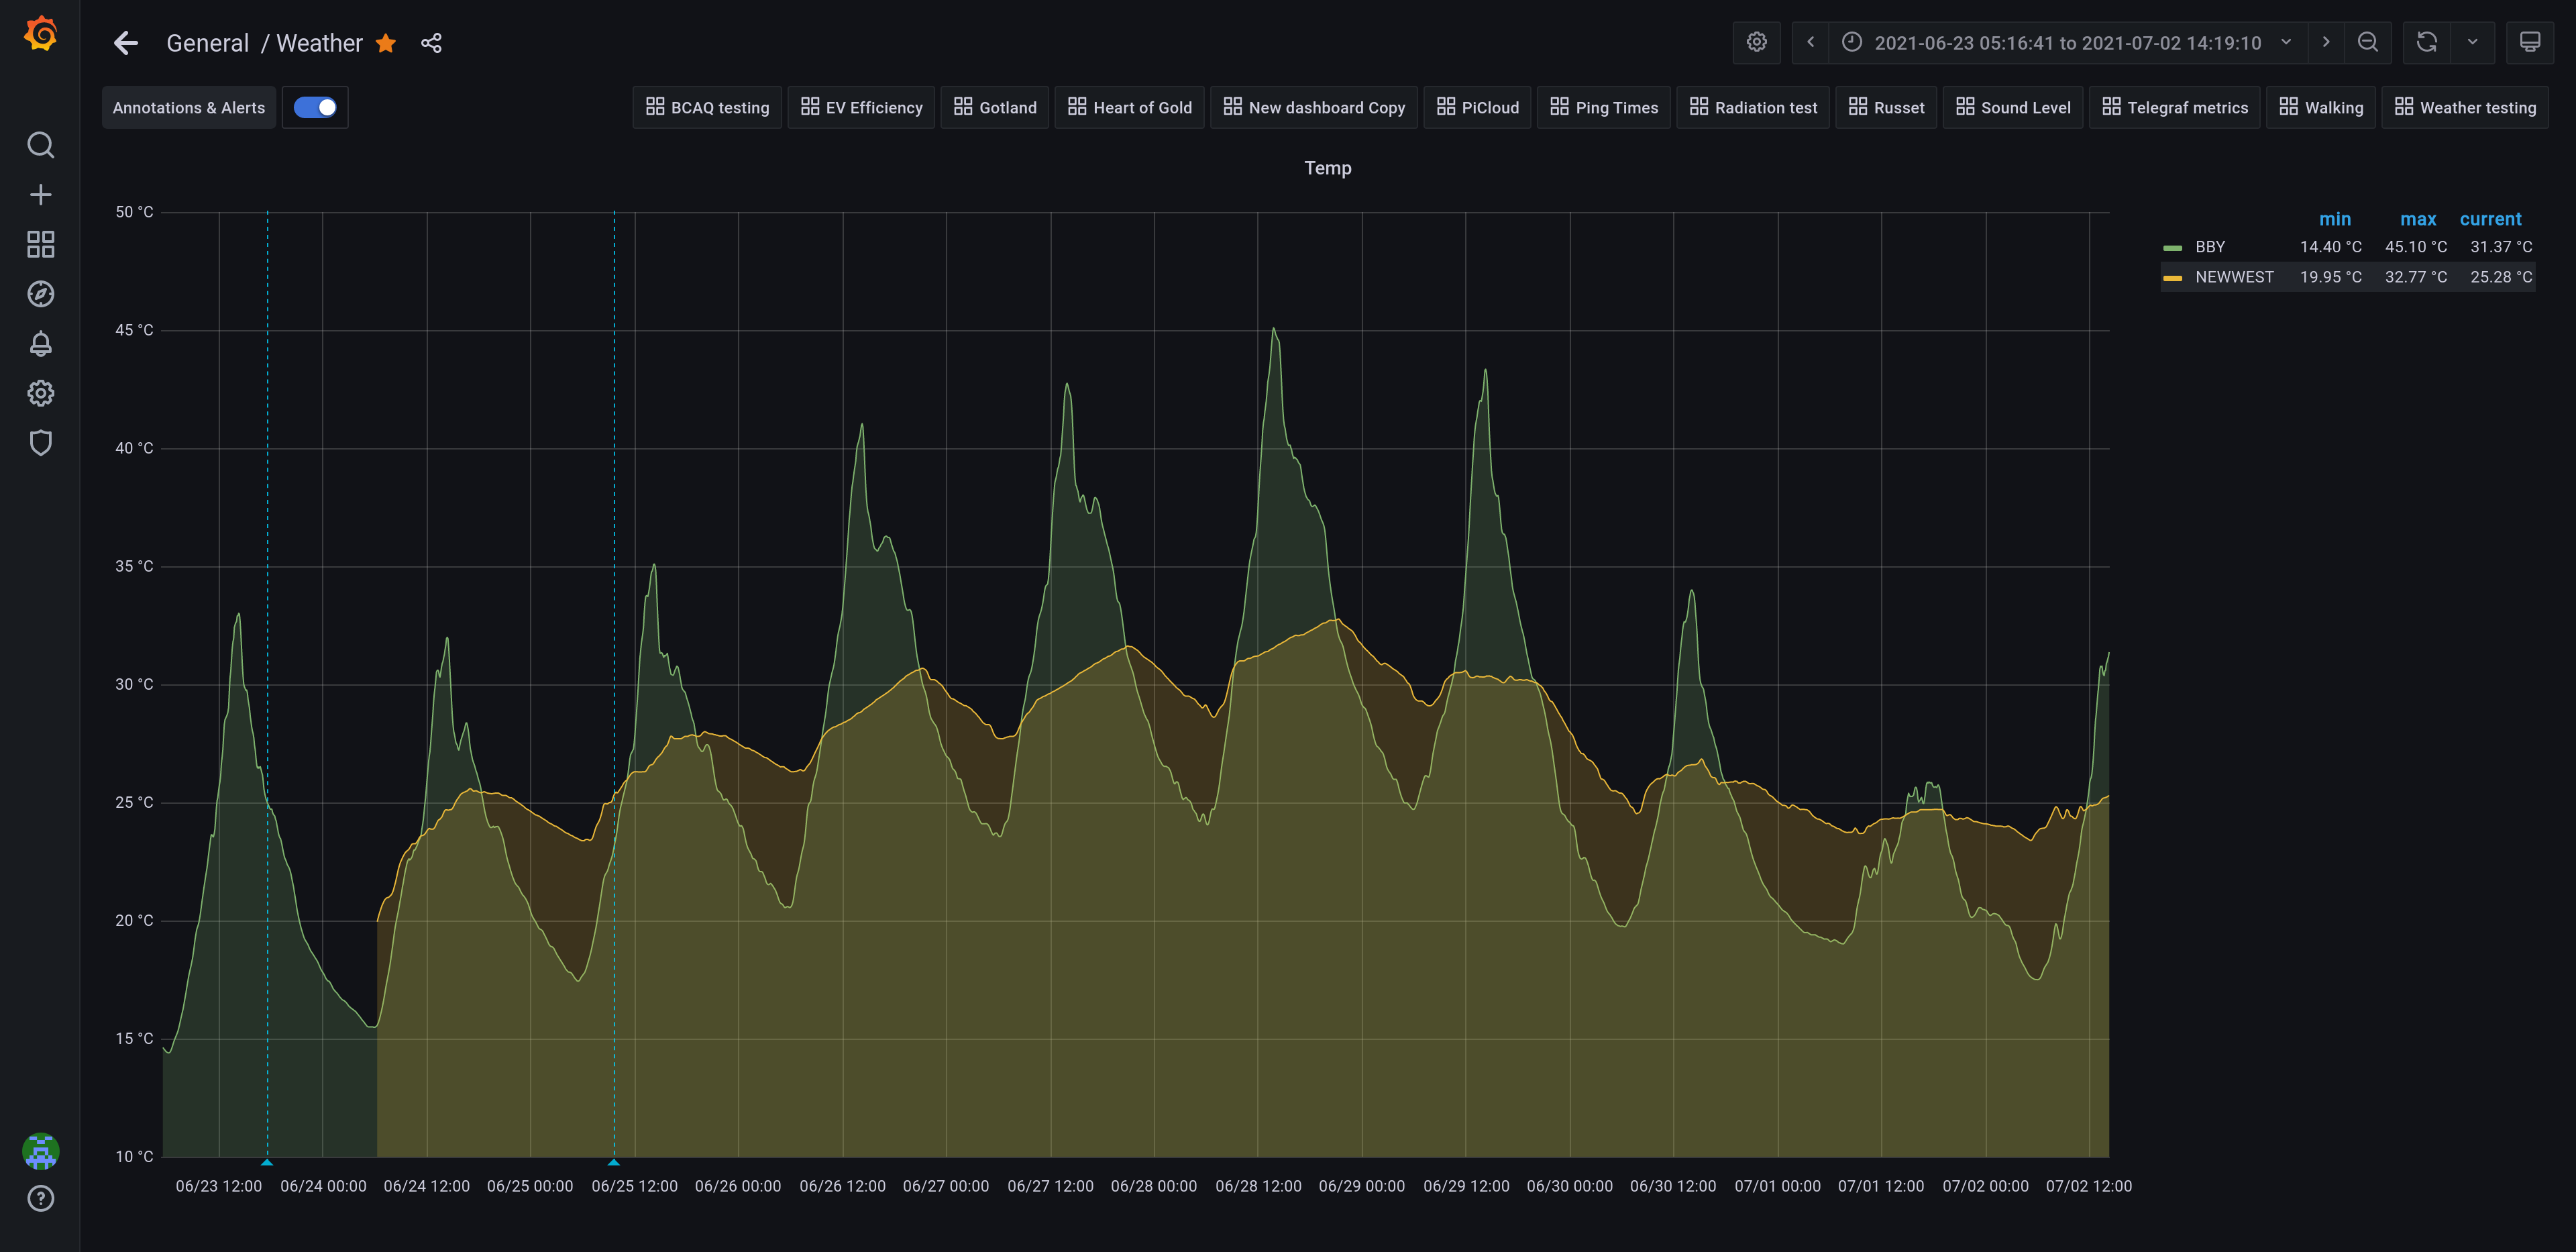
We went through the big heat wave; outside temperatures hit
45.1 C in the sun at my inlaws’ pace, and 32.8 C indoors at my
place; as for the max overnight temperature, it was 24.9 C at my
inlaws, and 29.1 C at my place:
This scared the shit out of me. A number of things have come out of
that.
For a start, my wife & I have begun talking about emergency
cooling. We’re in a townhouse and have no AC; we coped by staying
indoors, and taking us all out to malls & other places with
cooling. If there had been a widespread power outage, we would have
been in serous trouble. We’ve decided to start trying to prepare
for that, much as we try to prepare for an earthquake.
I’ve signed up for an energy efficiency assessment for our house,
which is something I’ve been meaning to do for the longest time.
Hopefully we can find some cooling options that are energy-efficient.
I’ve started with some battery-powered fans, and am running some
experiments to see how long they can run on simple battery banks
(like for charging phones). This is partly to get a bit of
experience, partly to make sure I don’t run out and spend a bunch of
money on something useless, and partly to – honestly – give myself
a sense of control by having some experiments to do. It’s not the
only thing we’ll do, but it’s a start. I’ll write this up later.
Another thing that came out of this is a commitment to writing my
local, provincial and federal governments every week for a year on
the climate emergency. This month: writing my provincial
government to end old-growth logging in BC.
Patrick Johnstone, one of my city’s councillors, wrote a
heartbreaking blog post about the heat wave and how New
Westminster responded:
It was a cascading failure, a demonstration we were simply not
ready, as a City and as a Province. People died, leaving behind
families and neighbours traumatized by the lack of response. I am
afraid first responders were equally traumatized, as they had to
operate in a broken and failing system that didn’t allow them to
do the work they are trained for and dedicated to doing – protect
and comfort the residents they serve. Instead, they spent three
days in the stifling heat surrounded by the suffering and death of
people they wanted to help. I cannot imagine, but once again, they
deserve not just our recognition and gratitude, but a response – a
way to fix this so they don’t have to go through it again.
More Aleasat meetings and helping them out as I can.
Data science
Start graphing EV efficiency data for our Kia Soul: cookiecutter
repo, import into InfluxDB, graph in Grafana.
More work on New West Trees. Signed up for a free account on Carto,
thanks to this tutorial; I’ll look at hosting this on PostGIS
locally, but for now this gets me started. Current state:
Able to search for 5 nearest trees
Able to display just a particular species of tree
Able to mark all the unknown trees with a separate icon
Got ethernet breakout boards for the weather station, which allow me
to use cat6 cable to take readings from Dallas 1-wire temperature
sensors. These will get buried in the soil at my inlaws’ garden. A
lot of soldering work to get this done, and then rebuilding the
Arduino software for the first time in years. Oh, and setting up
udev rules to create static rules for /dev/weatherstation and
/dev/sds011. …which I haven’t mentioned yet!
Bought a couple SDS011 particulate matter sensors; I’ve added one to
the weather station, and one at home. Interesting to see how
they’re doing.
Radio
Outing to local park; one QSO, truly awful signal reports from RBN.
Not sure what’s going on.
Replaced rain sensor on weather station at my in-laws
Tested running 3 Dallas 1-wire sensors over a 25 foot / 7.5 metre
ethernet cable: one twisted pair element each for positive, ground
and signal. Worked a treat! These are going to be buried in the
garden there to get soil temperatures at different depths
Radio
First POTA activation: Ve-3300, Cariboo Hill Park. 21 contacts,
including 2 park-to-park. Closest I’ve come yet to a pileup.
Power went out at my house for a few hours, so I used the time to
make contacts on my homebrew magloop on 20m while it was dead quiet.
Made England, plus one with KD6JUI/MM, who was kayaking (!) with a
homebrew magloop (!!).
CQ WPX contest: 55 contacts over 3 days. I’ll be honest, it was a
bit of a chore by the end. But I managed to make New Zealand on 5W,
and Australia on 5W on 40m (!).
Replace failing hard drive for Zombie, the home server that does it
all.
Hardware hacking
More work on the anemometer. My father-in-law built a shelter for
this to keep the rain off, and we’ve now got the sensors/magnets
permanently (*with crazy glue) mounted on the arms.
Radio
First attempt at POTA, at a local park. Unfortunately, I only got
four QSOs, so no good. I think part of that is probably due to the
location: it was in a lower part of the park, and it seemed to
affect propagation.
A while back I started exploring data from the Reverse Beacon
Network. My initial goal had been to come up with an ML model to
predict how many DX stations the local skimmer would receive – but
there was a lot of exploration of the data as well. I captured that
exploration in a series of notebooks, and set aside the project
after a while.
One of the things I never accomplished was a satisfying display of
where stations were being received from. I was aiming for something
that would show changes over time, as well as location. Yesterday I
was browsing through this Kaggle notebook for the BirdCLEF 2021
competition when I saw a cool map being generated from something
called a shape file. A bit of browsing through the Internet found
some great tutorials, and I think I have a better sense of what I
can do.
The Libre Space Foundation (and thus Polaris) was accepted for the
Google Summer of Code, and we had bunch of awesome students show
up in our chat room. A lot of work came out of that: coaching
students, evaluating their MRs, giving early feedback on proposals,
and helping them find their way through the codebase and the
problems. But these are definitely good problems to have!
Dig into more options for image augmentation, including Albumentation
Came up with a rough prototype for the Dishwasher Loading
Critic: a (poorly) trained model, sitting behind an API written
in Fast, with a copied bootstrap template. I was able to post
pictures to it from my phone & get some (poor) bounding boxes around
things. Progress!
Still trying to figure out where I want to go with this project:
stick with Detecto, or move to PyTorch? I’d like to do the latter,
but I have a lot of learning to do there.
Got LSP-mode enabled for Emacs. Interesting, and I suspect this
will be a way forward for Emacs.
Tried Paperspace again after their upgrade, and WOW: it’s
blazingly fast to start up. I’m going to re-open my account with
them again.
Sysadmin
Finally got Fedora 33 installed on an Intel NUC. The problem had
been that wifi did not work after installation, even though it
worked during installation. Turns out there’s a bug where
wpa-supplicant is not installed during installation; installing it
afterward by hand did the trick.
Learned about nftables…huh.
Hardware hacking
First prototype of anemometer working – I’m now able to get RPM
read and displayed in Grafana. Apparently, the best option open to
me for calibrating this thing is to use a car: hold it out the
window, go at a set speed, and take measurements.
Began Chapter 9 of the FastAI book. This is on tabular
learning, which is really interesting; I think this is the sort of
approach I’d want to take for loostmap, my attempt to predict
HF propagation by looking at data from the Reverse Beacon Network
(I picked that project name from a random name generator…I really
need something that makes more sense.)
Played with Roboflow, an online service that augments image
data for machine learning. Also came across imgaug, a Python
library that covers much the same ground.
Talked to my manager about the possibility of looking for DS/ML
projects at work. Apparently there’s one team he knows of that’s
looking into a project in this area, and the possibility exists to
work with them for a bit. 🤞
Hardware hacking
My father-in-law finished a prototype of our anemometer; he’s a
retired millwright, so he actually knows what he’s doing. (puts
popsicle sticks and yarn away)
Radio
A few contests entered. Closer to getting my WAS – only missing
Maine and Nebraska, and state contests for those are coming up in
the next few months.
Backyard bird count, plus started doing counts in local parks on
weekend; submitted through Audobon app, which goes to
ebird.org.
Gardening
Began growing wildflower seedlings at home under a grow lamp and
promptly got mildew. There are a couple that have survived; I plan
on transplanting those & trying again.
A while back, I started having problems with the output of Venus, a
planet-like aggregator I use to read a bunch of things. The symptoms
were broken characters for things like apostrophes, quotes and so on
– which rendered the output nearly unusable. I dug into it,
but couldn’t resolve the problem…so I resorted to a bletcherous hack
(cron job to copy the file to my laptop, and view it with
file:///...) and blamed Python 2.
Today I came across the same problem but manifested in another set of
files. This time I managed to find the answer:
AddCharset UTF-8 .htm .html .js .css
To be clear, I already:
had made sure that the headers for the file included Content-Type: text/html;charset=utf-8
had made sure the html file had <meta charset="utf=8">
worked…the apostrophes and such were displayed correctly. But they
never showed up in the output when I ran a curl on the URL. Does
Apache filter this stuff on the fly?
Anyhow…that’s enough encoding debugging for one day. Or possibly a year.
Here’s a quick list, for my own reference, of what I got up to in
January. It’s heartening to see everything laid out, and realize that
I’ve actually managed to get a fair bit done!
Hardware hacking
My father-in-law and I worked on getting the precipitation meter
going for our weather station. It took a while, but we finally
got it working. 🎉
Some one-wire temperature sensors came in, and I was able to whip up
a quick demo to make sure they worked.
Talked to my father-in-law about building a Lehmann
seismograph. Early days, but I think he’s in.
Got a hugo site whipped together for polarisml.space, which now
has links to our demo, code, chat and documentation.
Cut my first release for Polaris after getting our page on PyPi
sorted out.
Machine learning
Some progress, though slow, on going through the FastAI book.
Tripped over Roboflow, which generates synthetic data for ML;
very interesting, and I may give this a try for the dishwasher
loading critic.
Some initial experiments with detecto, a simple wrapper for
PyTorch object detection.
Radio
Not a whole lot of trips out, but some…and managing to reach D4Z Cape
Verde on 10W. 9,155 km!
Totalled up my contacts toward SKCC Centurion…42/100. Normally
I’m not big on this sort of thing, but it’s a number to reach for,
and that’s no bad thing right now.
I’ve been interested in machine learning for a while now. Like a lot
of things, my approach has been a bit scattered. I’m slowly learning
how to get better at that, but I still tend to veer around.
A couple of months ago, I decided to take the Fast.ai course
again. I had done a couple of lessons a year ago, but had not
followed it up. This time around, I saw that they not only had a new
version of the course, but a book as well. I ordered the book
(and another book as well), and got started on the Jupyter
notebooks that the book is based on.