Seismometer First Look
Hello, world! A couple weeks ago, I took delivery of a Raspberry Shake 1D. It’s pretty sweet. Right now it’s set up at my inlaws' house, and I wanted to see how it’s doing by looking at whether it can detect recent larger earthquakes.
Macquarie Island Region: Mag 5.9, June 9 2023, 21:21:42 UTC
I’m starting with the USGS map of recent earthquakes:
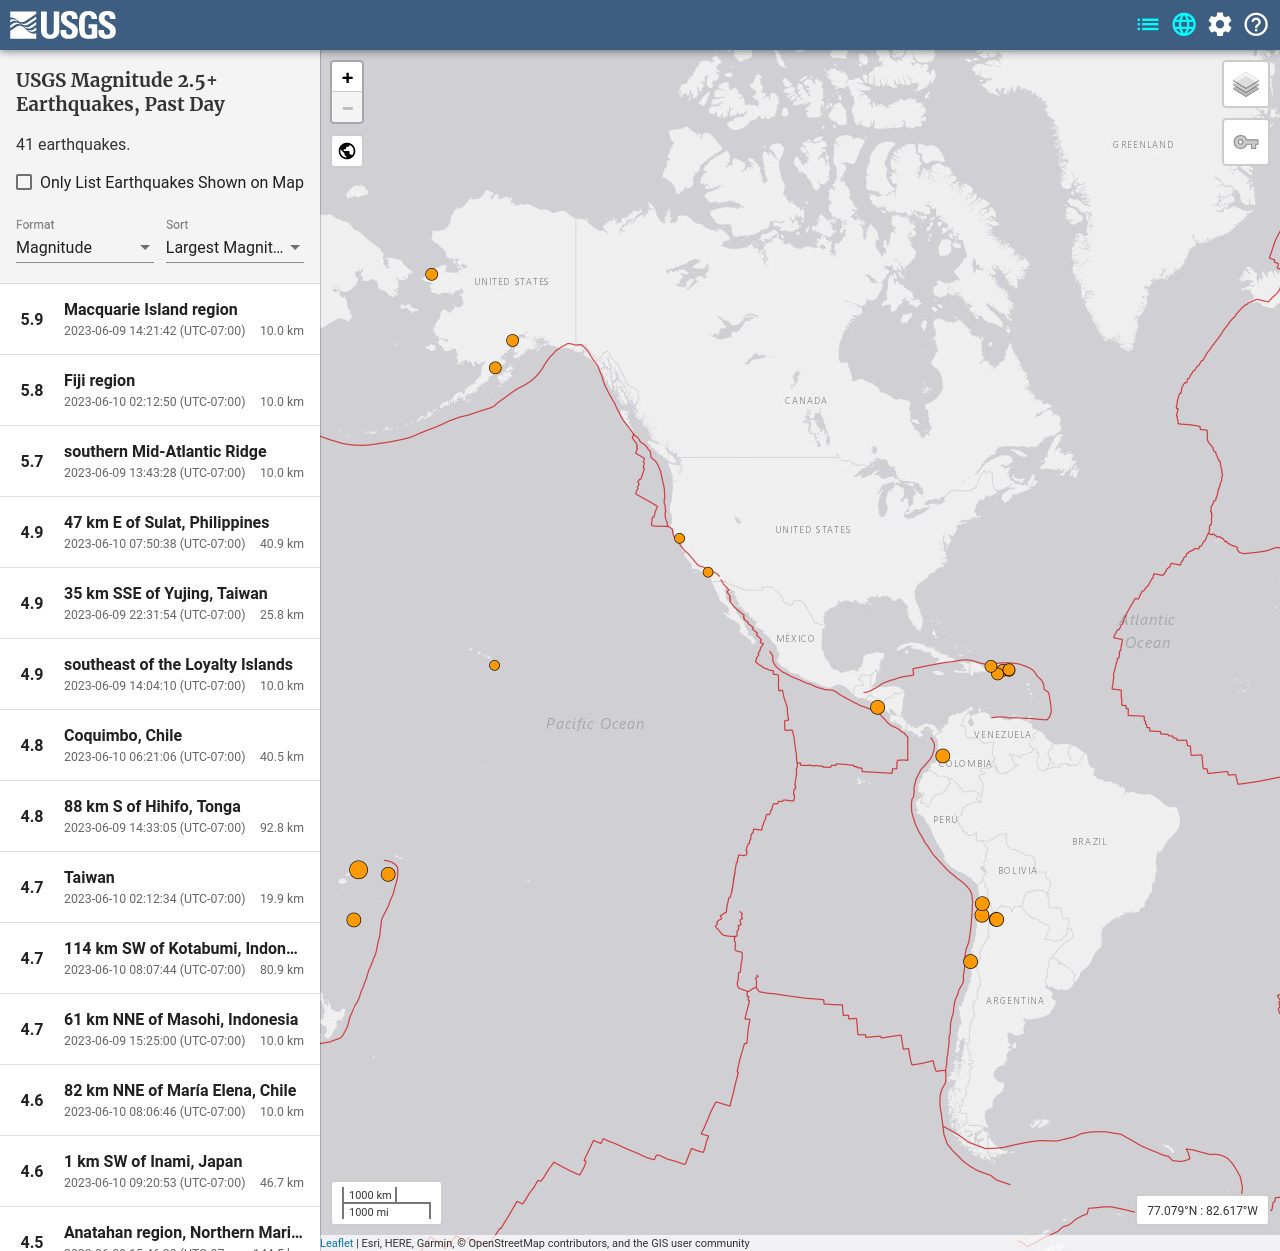
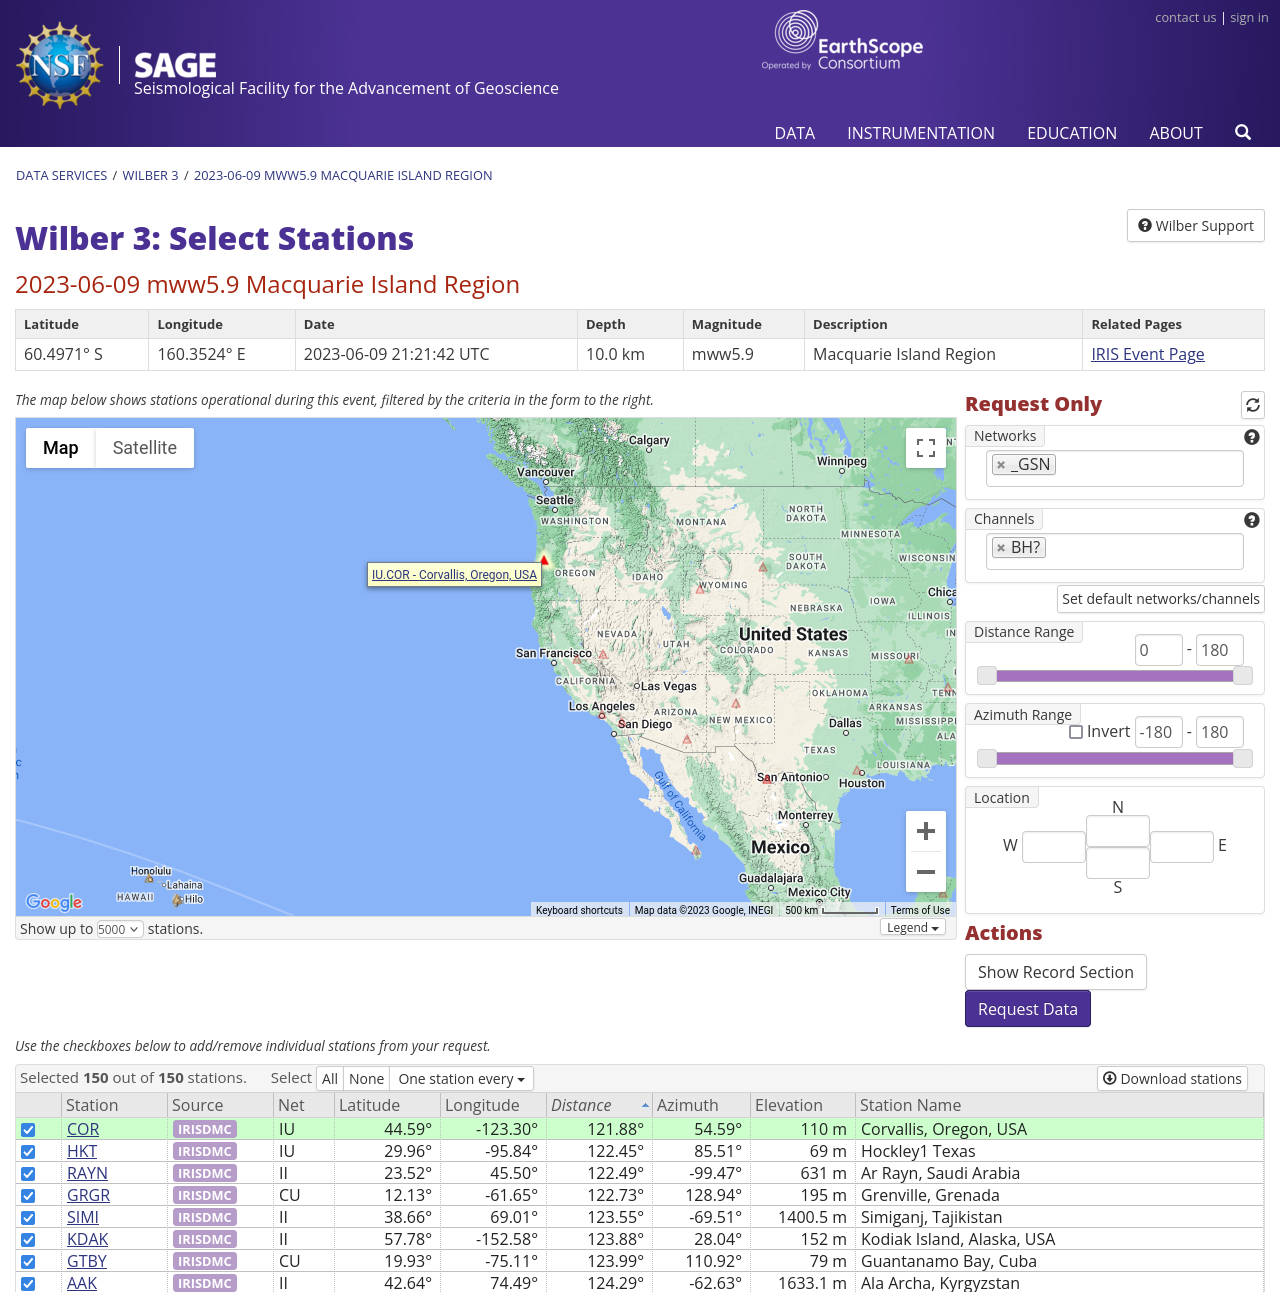
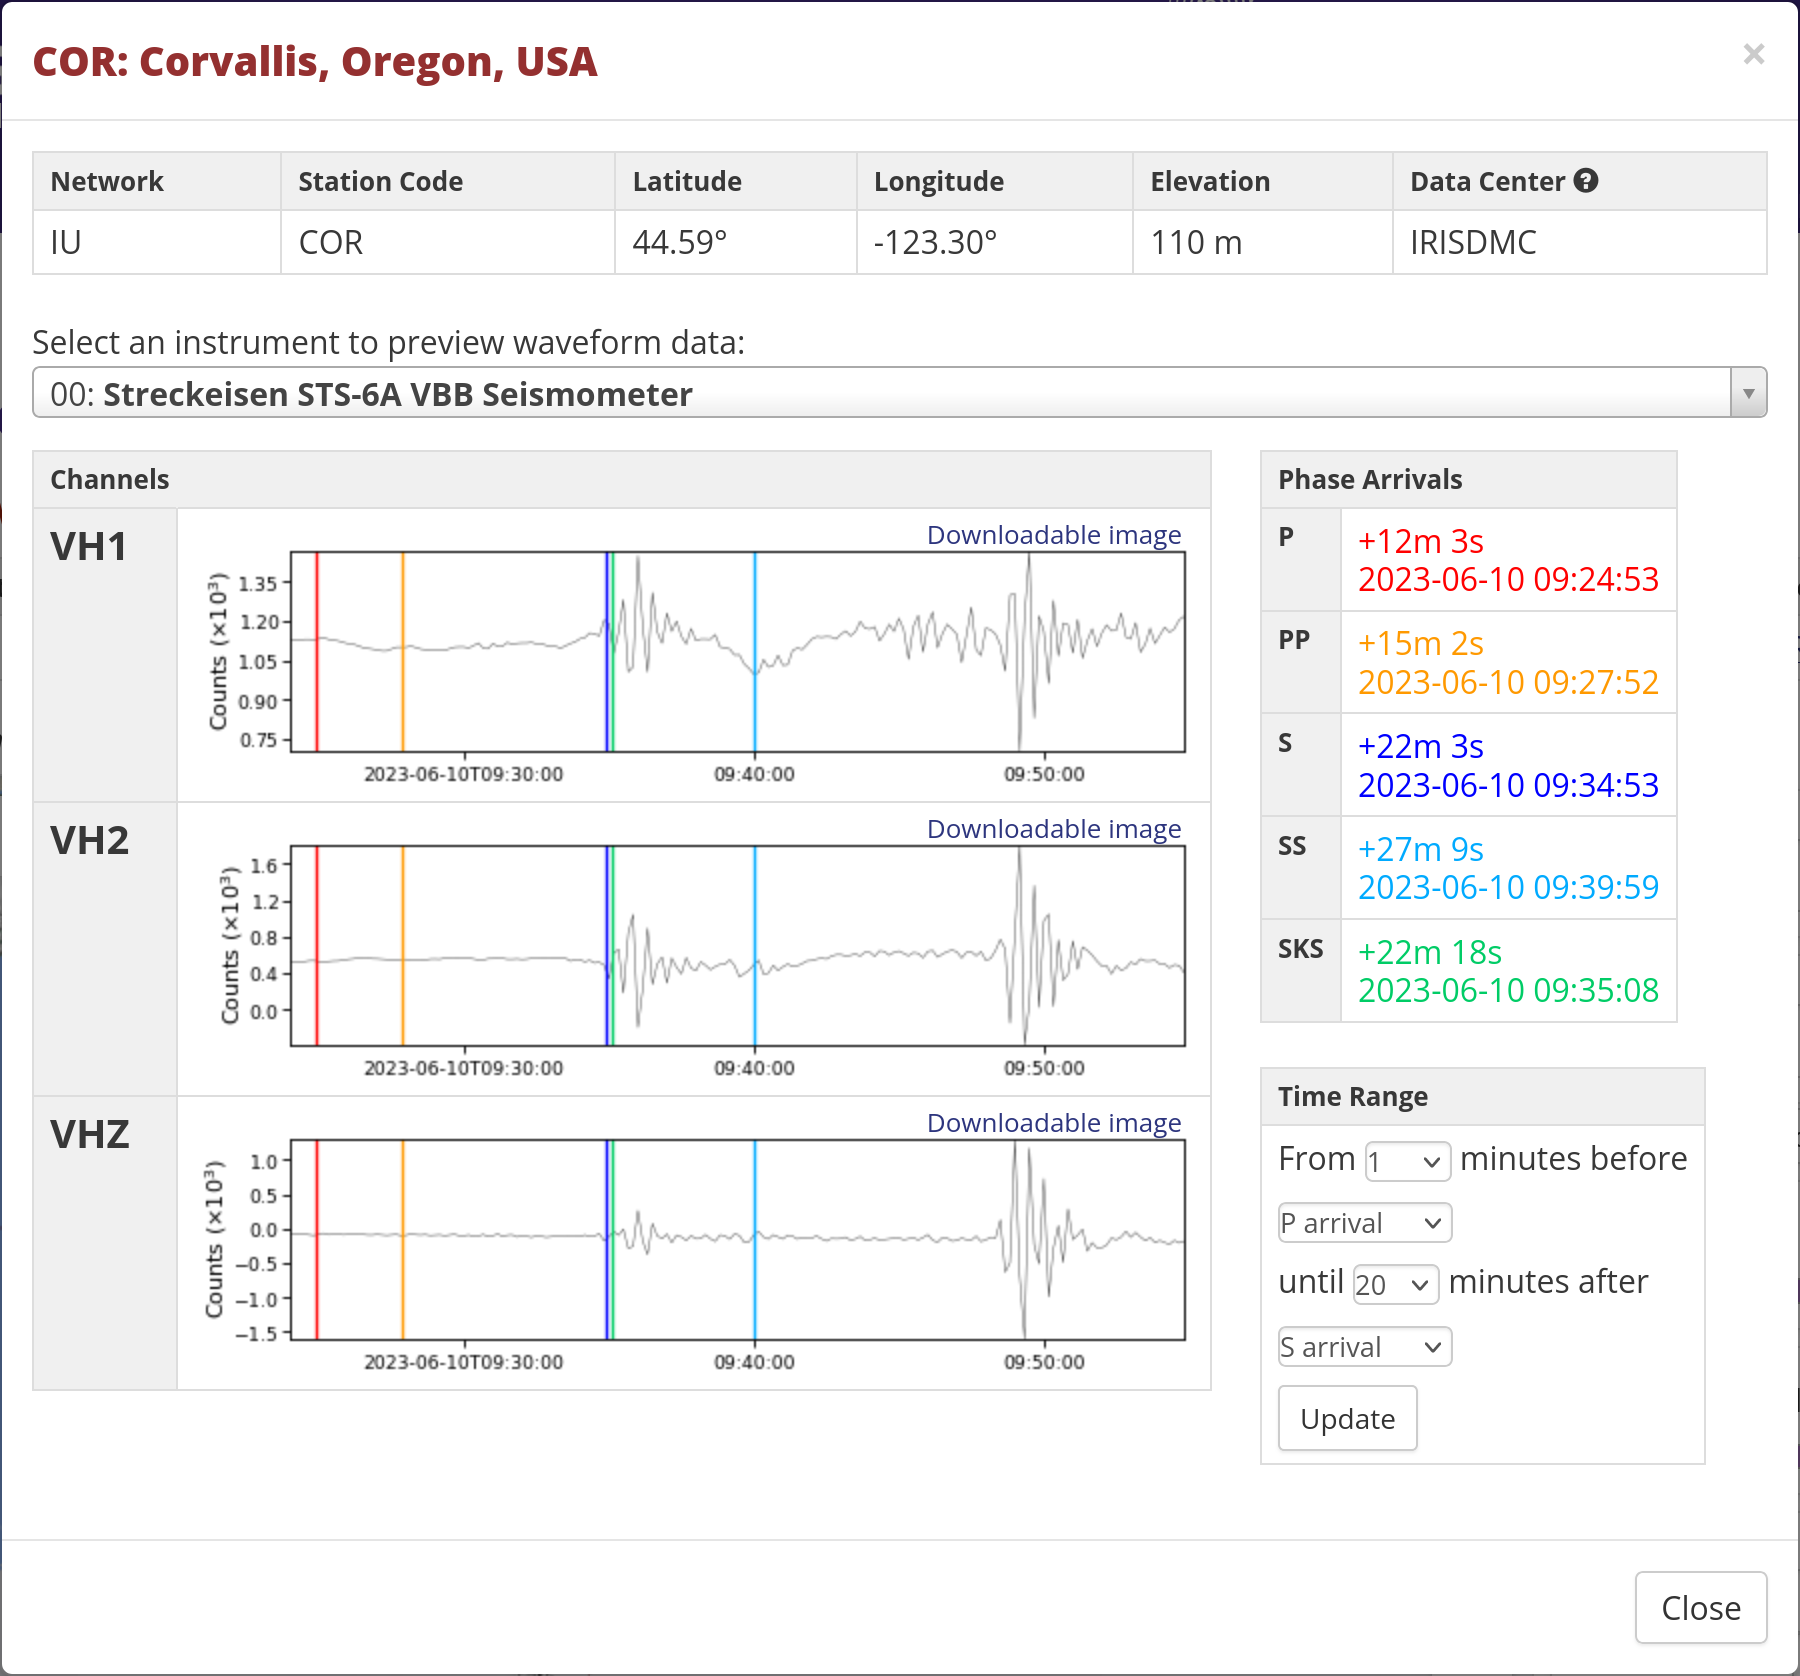
From there I can drill down to individual earthquakes – such as that first one, 5.9 in the Macquarie Islands. Going to Waveforms takes me to this page, which lets me find stations that recorded data from it. Looks like there’s one in Corvallis, Oregon:
Clicking on that gets me the data:
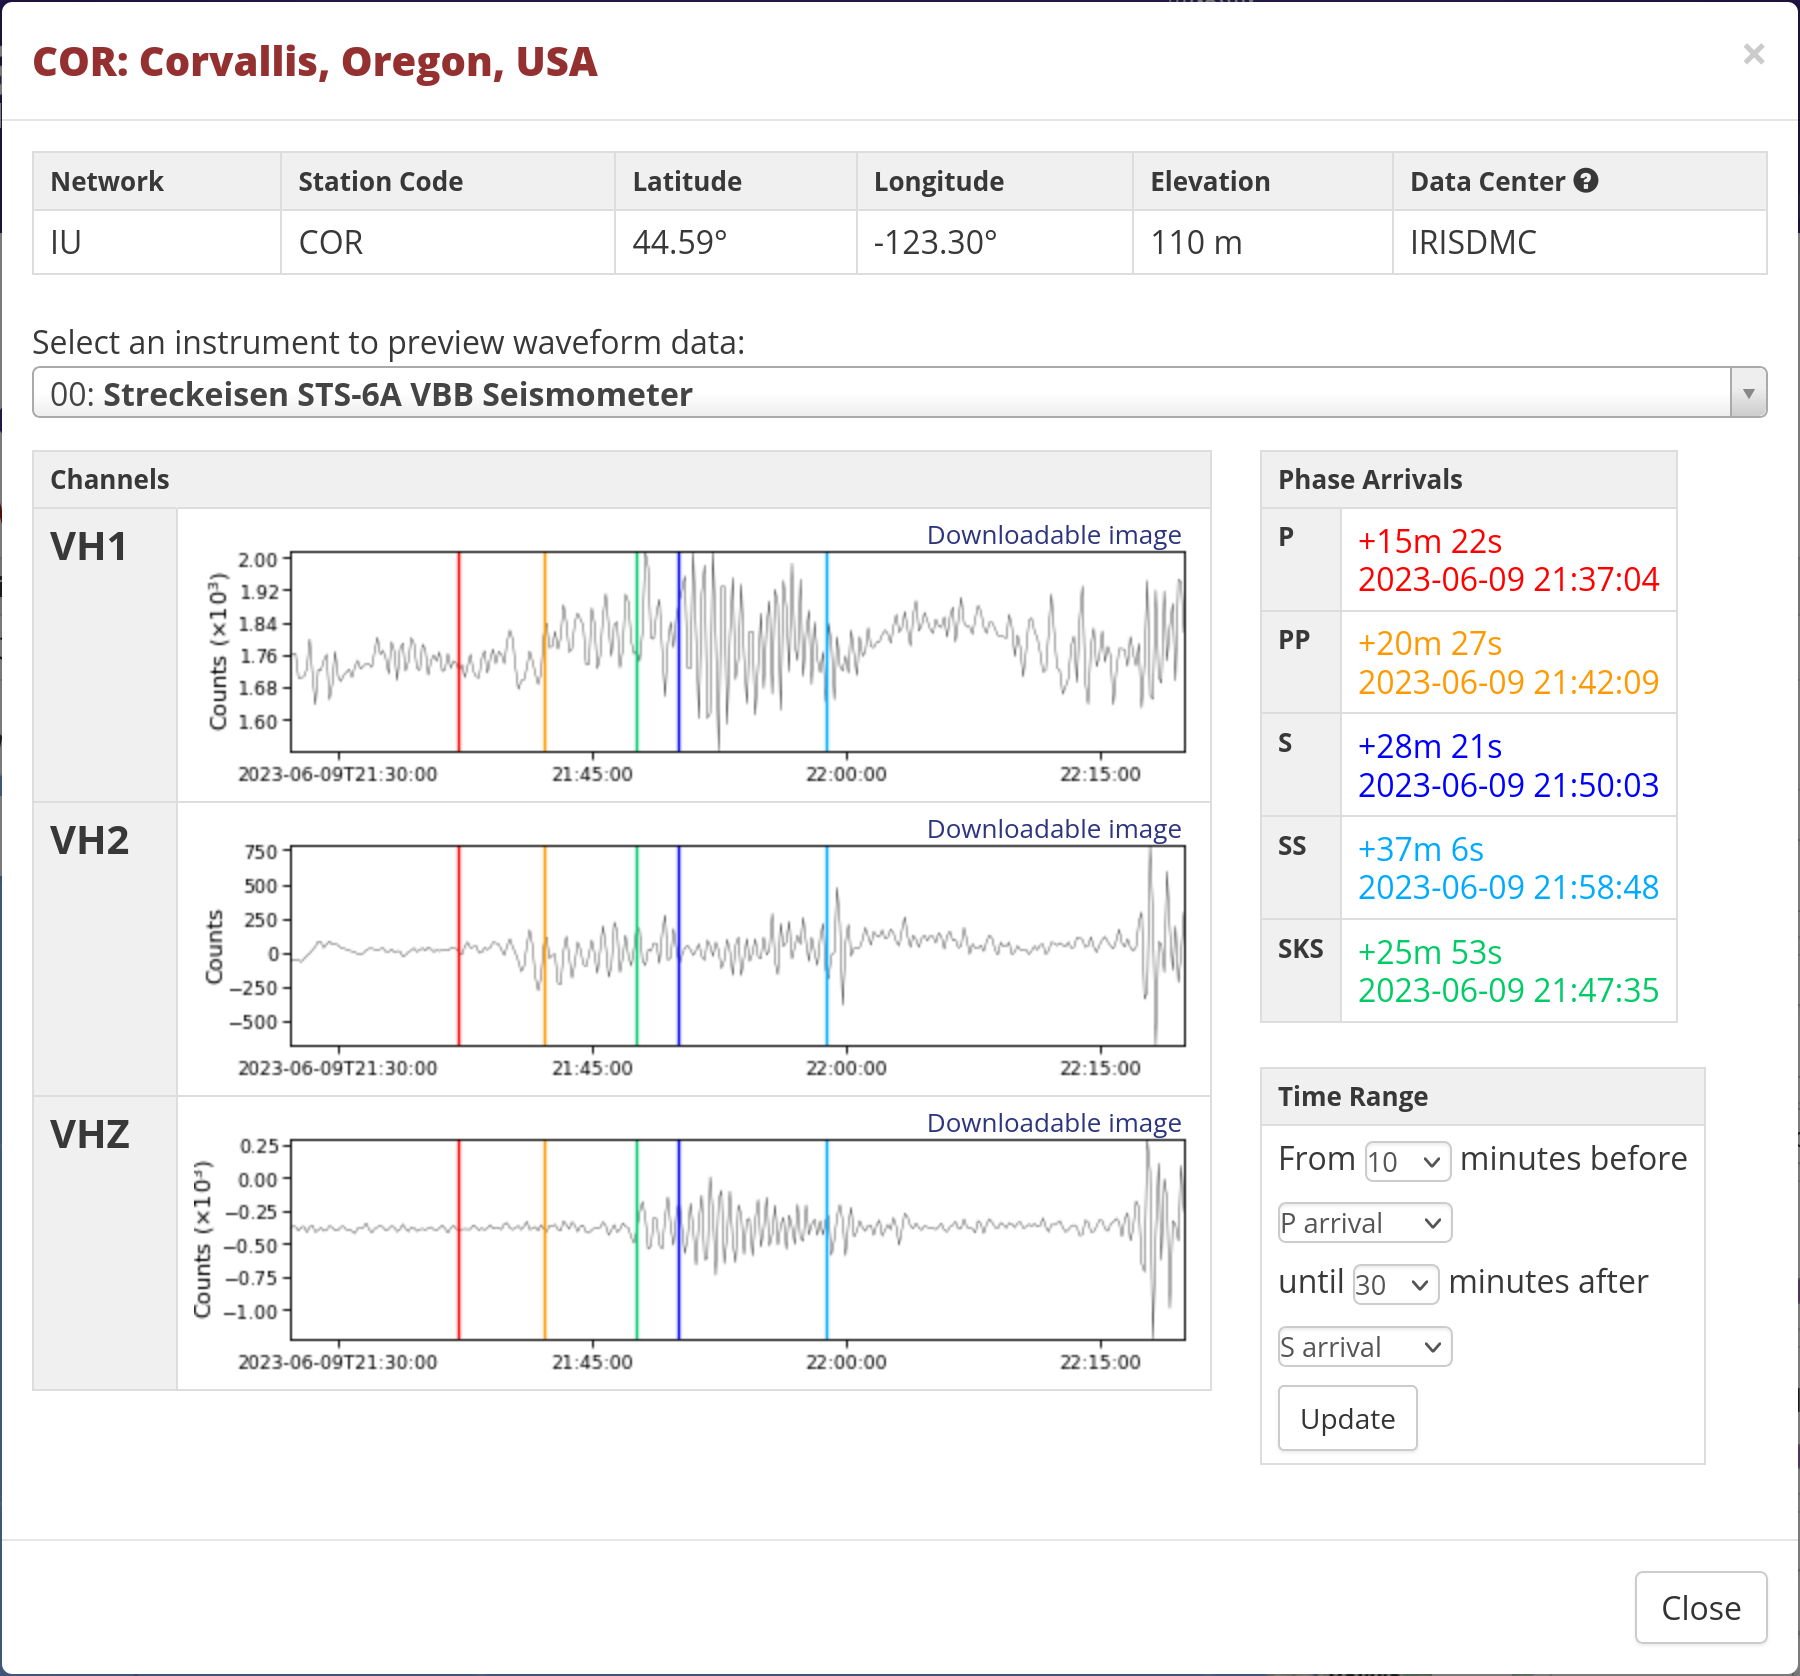
Side note: this is narrowed down to VH channels. V means a sample rate of ~ 0.1 HZ; H is a High Gain seismometer; and Z means vertical orientation. From there I can see when the phases arrived. The original earthquake, according to the USGS, happened at 2023-06-09 21:21:42 (UTC); the P phase arrived 15 & a half minutes after that, and other phases past that. The P is barely noticeable, but the PP and S waves definitely show up.
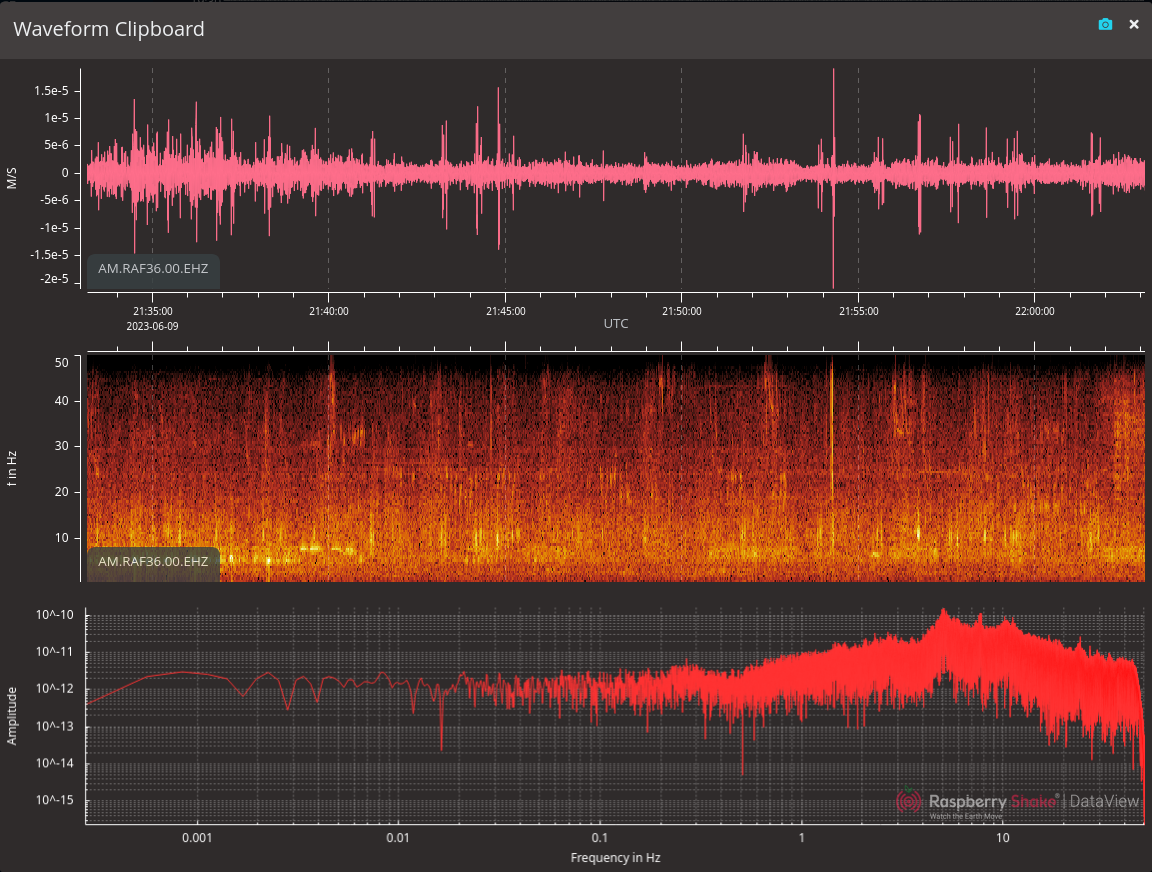
It’s interesting to compare this with the heliplot:
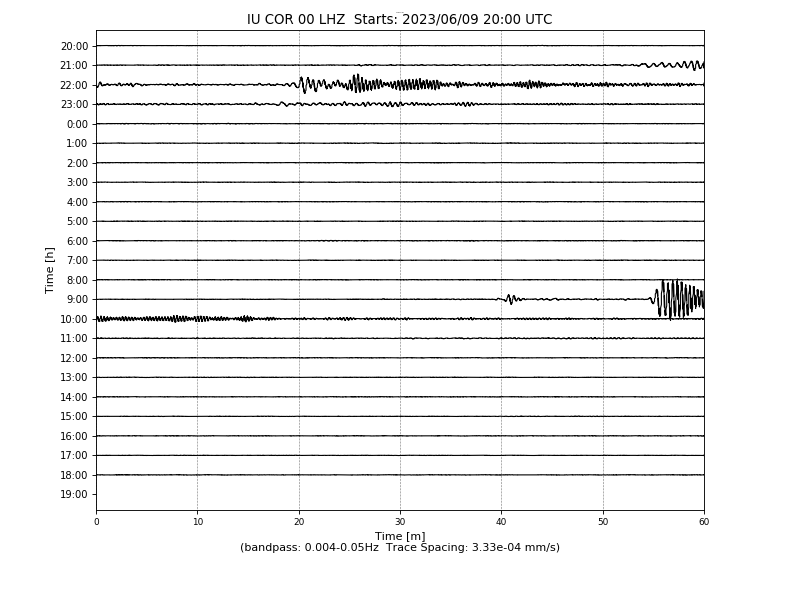
So – how does this compare to my seismometer? The Corvallis station is 13,550 km away; mine is 13,990 km. The arrival time should be a little later – by simple/stupid math, about 30 seconds later.
I’ll be honest: for this one, I’m not sure I see anything. The spike around 21:52 seems like a candidate for the S wave.
Fiji Islands Region: Mag 5.8, June 10 2023, 09:12:50 UTC
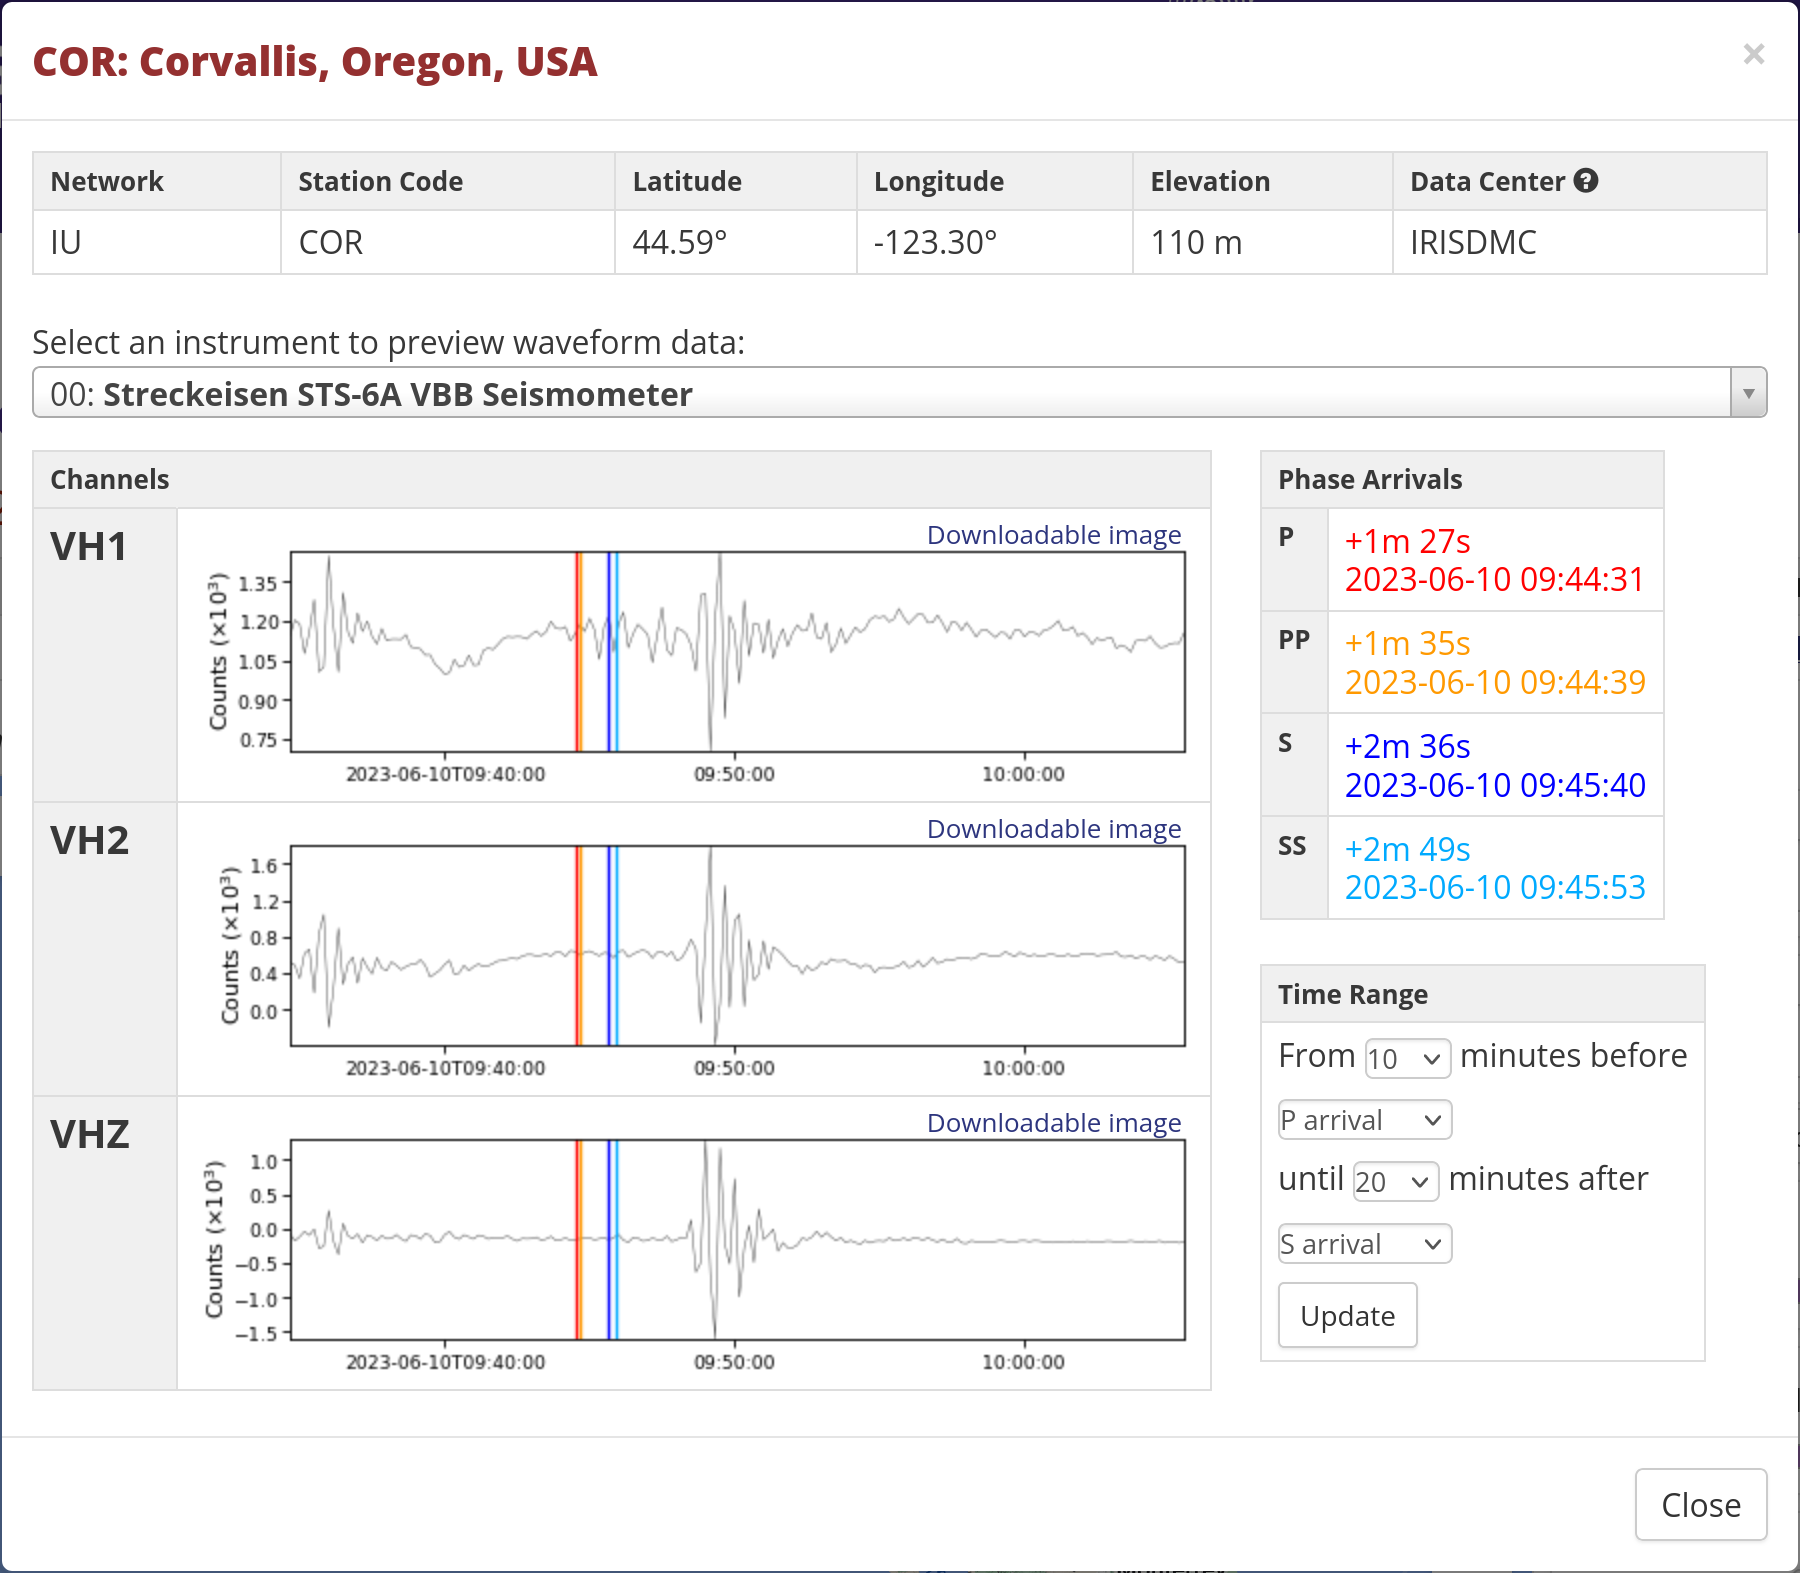
Here’s the USGS page for this one, and the IRIS page. Here’s the Corvallis data:
I’m curious to know that that 09:50 spike is about…but let’s keep going. The S and SKS waves showed up pretty strongly at 09:35 or so. Here’s what I saw:
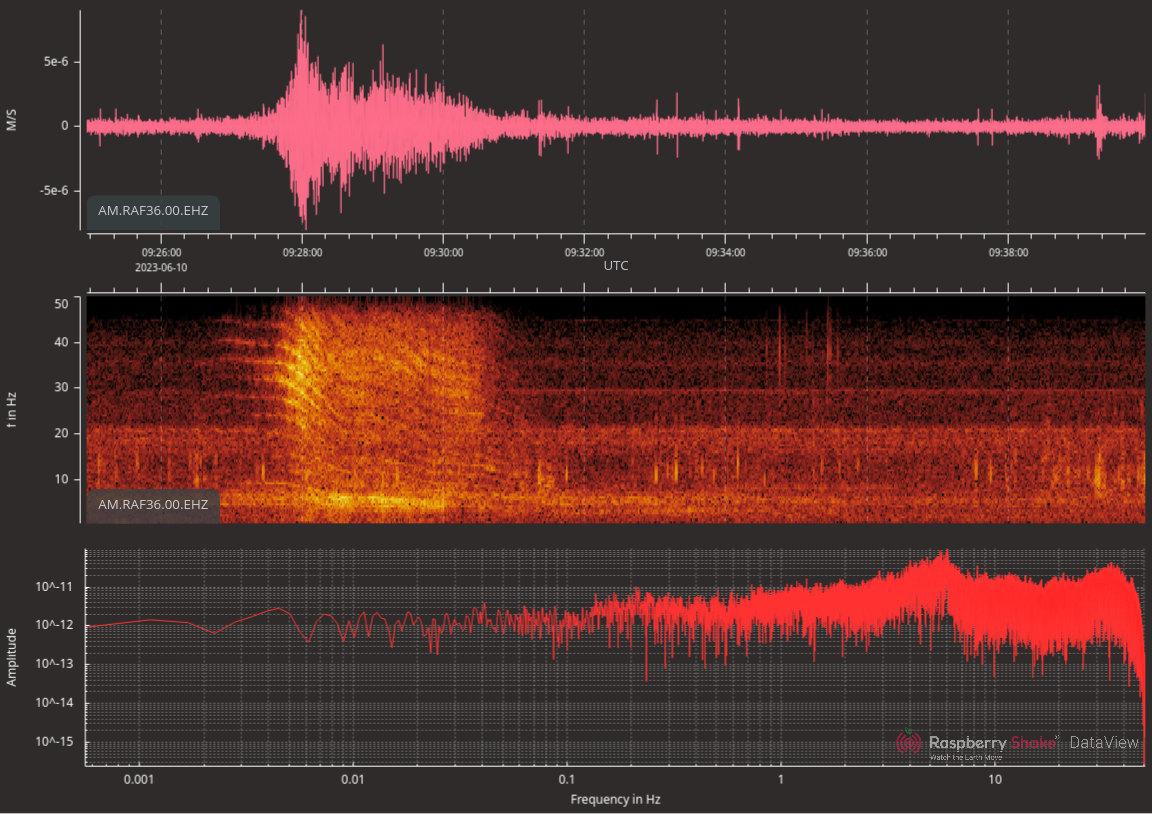
Don’t know that that 09:28 data is, but there’s bupkiss at 09:35. Hm.
Anderson Springs, California - Mag 2.6, June 10 2023, 09:43:04 UTC
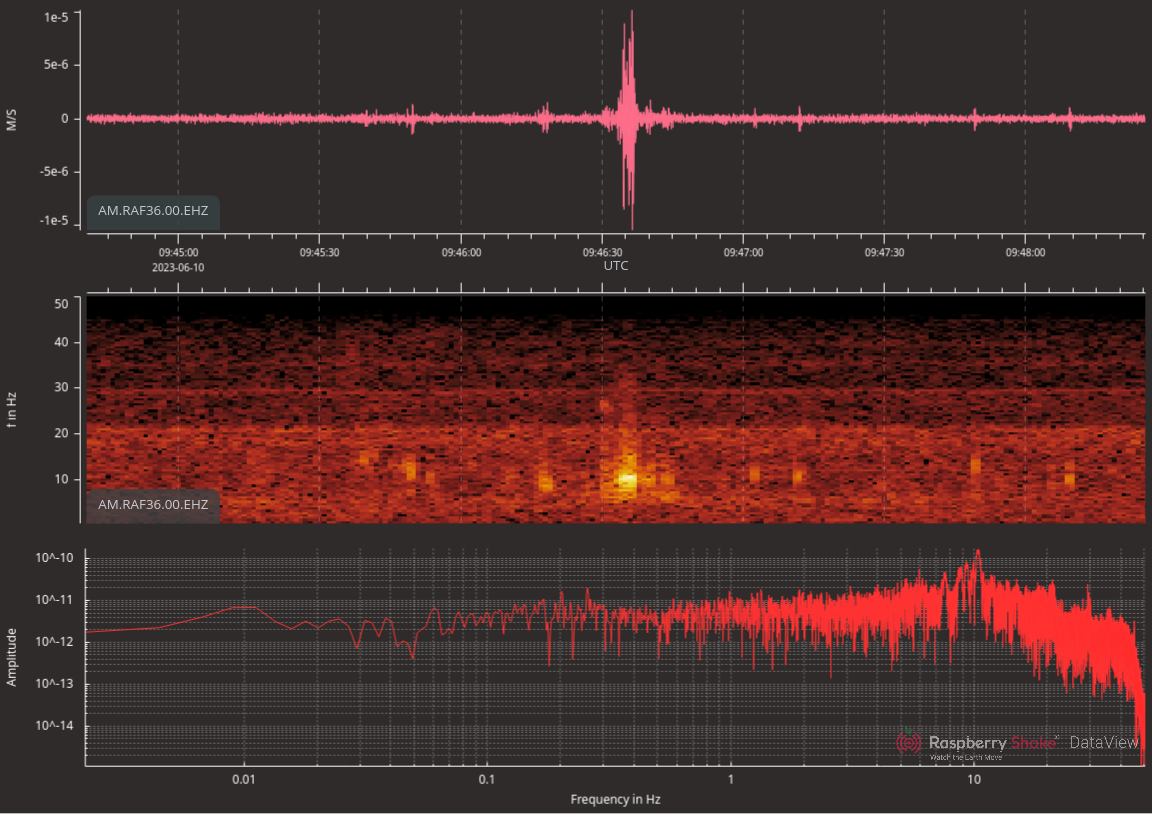
The peak at 09:50 caught my eye, so I tried looking for anything around that time. I found a small one near Anderson, California. Here’s the IRIS data:
That doesn’t seem a good fit either…but: Corvallis is 652 km away from the epicentre, and it took 90 to 170 seconds for the waves to arrive. I’m 1164km, about 1.8x further. Again, stupid math: 90-170 seconds becomes 160 to 306 seconds, or about 2.5 - 3 minutes. And look at what I recorded 3 minutes after that quake:
Here it is really zoomed in:
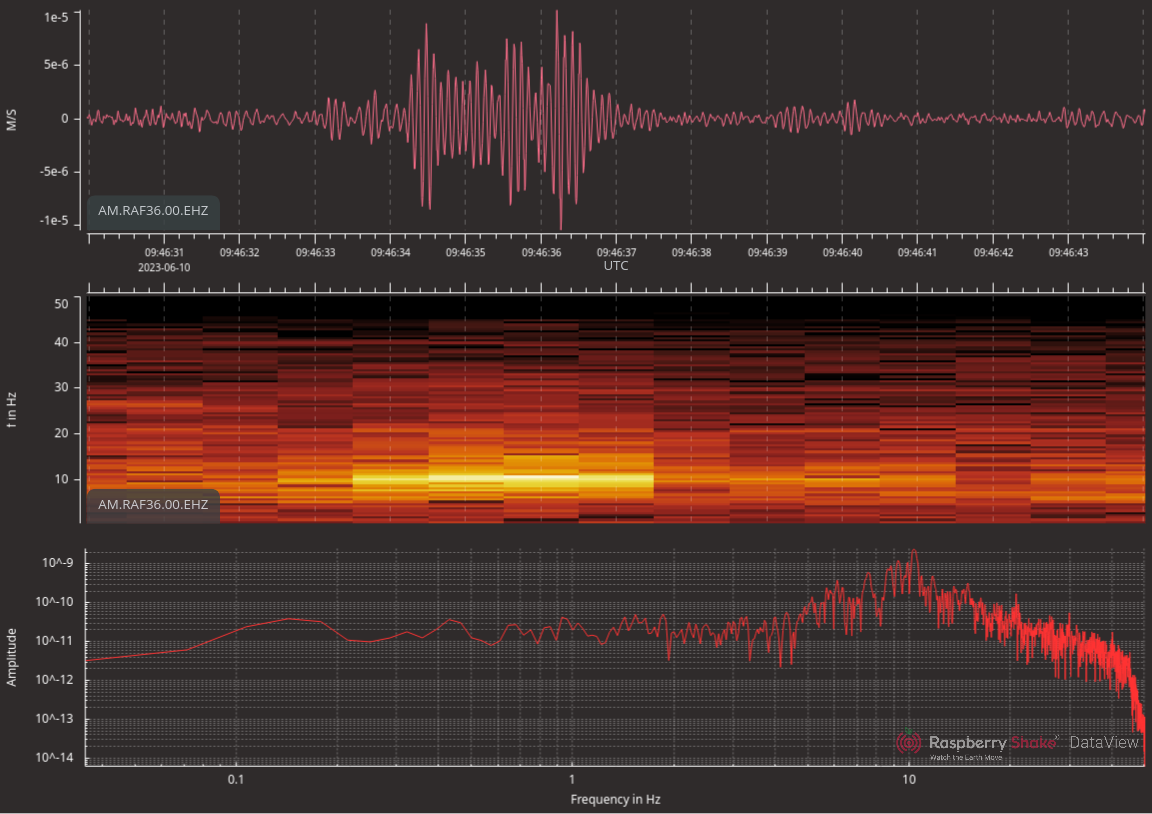
This seems like a good candidate to me!
So what next?
All this is just a first pass through the data (and a very manual one at that).
-
I’d like to do more digging. Finding some way to automate at least the collection of links & data would be wonderful.
-
I’d also like to compare my data against this station in Queen Elizabeth Park in Vancouver, run by Natural Resources Canada. I do wish it had a little better data view.