Seismometer revisit
I’ve found much better ways of examining earthquake data received by my station. Thanks to Alan Sheehan, who was kind enough to post his excellent report generation tool, I’ve now got some actual data we can use. I’ve updated his code a bit and changed it to better match my workflow; my repo is here. Like Alan’s, my code is under the MIT License. Share and enjoy!
Here’s a sample of what we’ve been able to see:
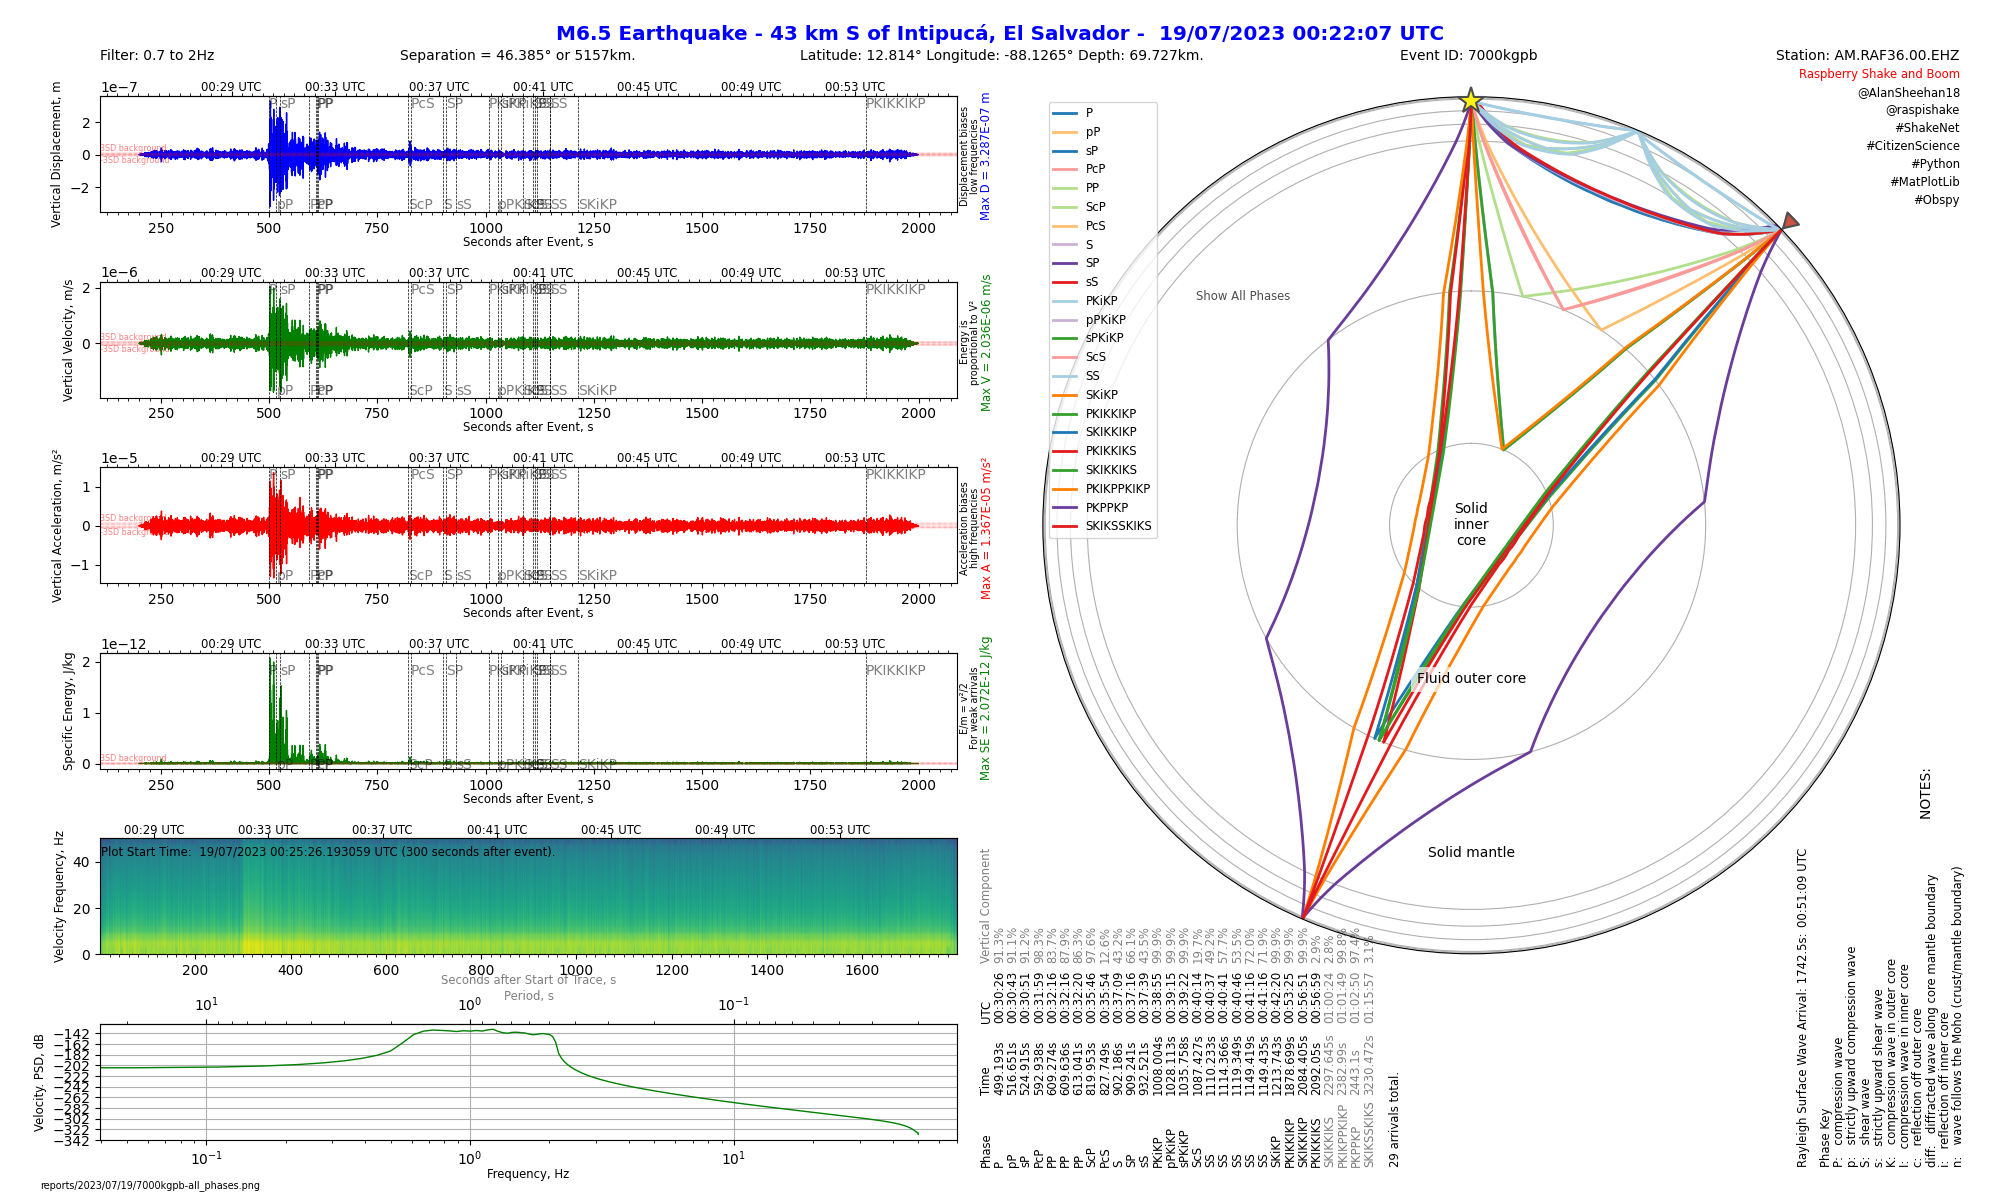
This is the result of a magnitude 6.2 earthquake that struck off the coast of El Salvador. Fortunately, no damage, injuries or fatalities were reported.
Here’s a sample of what I’m pretty sure is a freight train going by:
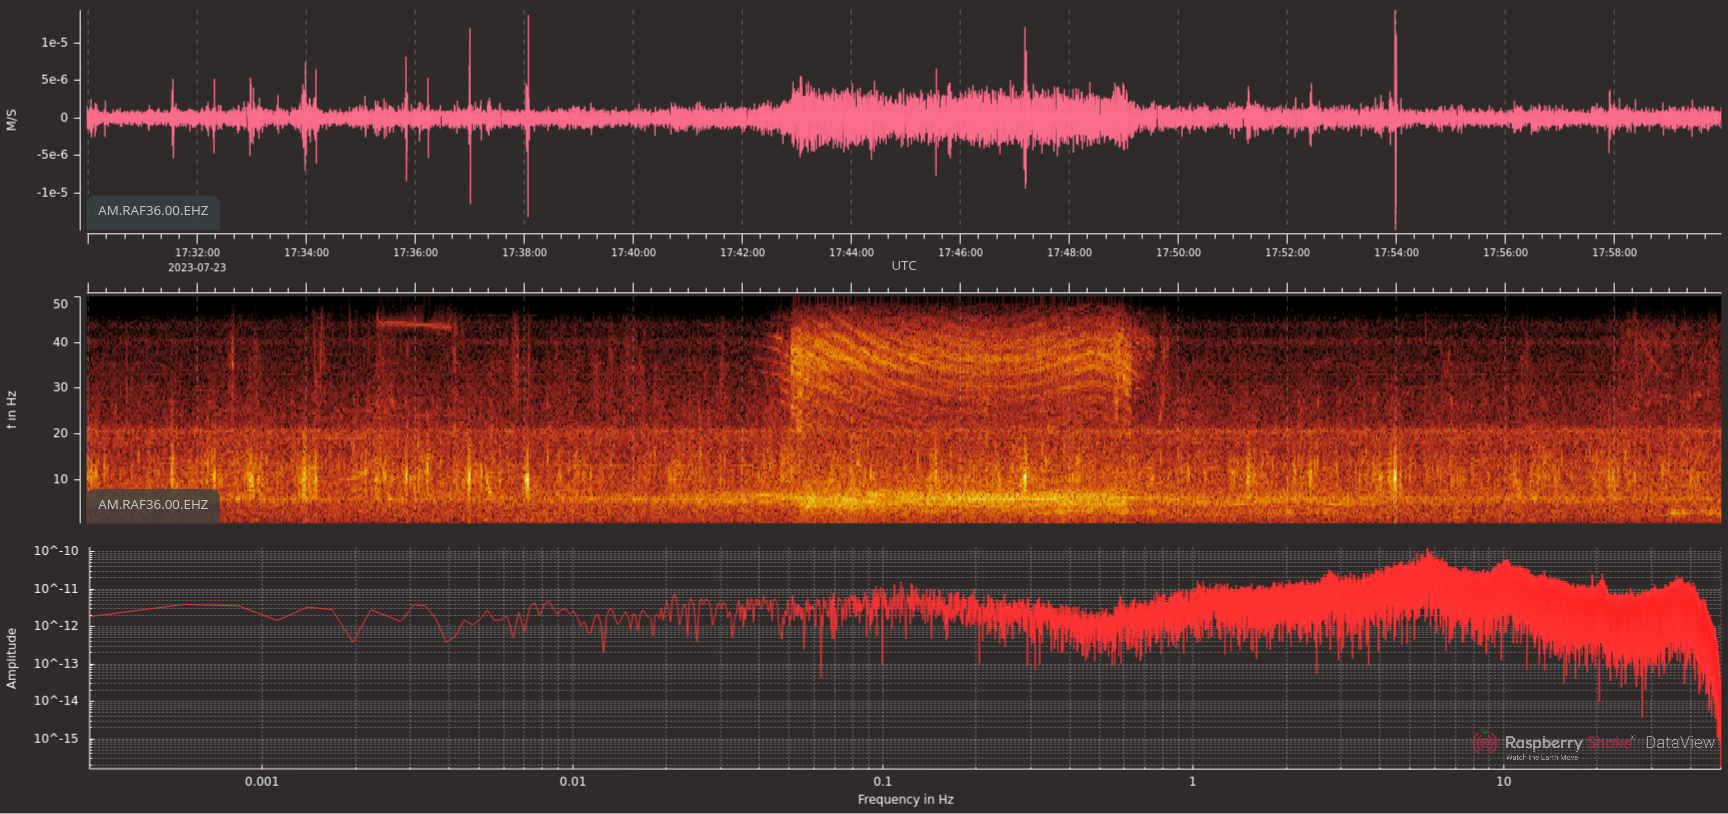
This happened about 15 minutes after I saw the train go by another crossing about 10km west of where the seismometer lives. The equidistant lines in the spectrum sure seem like the ones reported in this study, “Equidistant Spectral Lines in Train Vibrations” by Florian Fuchs, Götz Bokelmann, and the AlpArray Working Group (https://doi.org/10.1785/0220170092 …but see the previous link for the actual paper).